Overview: Recent reappraisal increases are far outside historical norms. The 2023 reappraisal and update increase was 7.3 times as large as the prior reappraisal and update increase for the same counties in 2017, while the 2024 reappraisal increase was 4.7 times as large as the increase in 2018 and the 2025 increase was 3.9 times as large as the increase in 2019. Also, while the 2025 statewide average reappraisal increase of 26.0% was lower than those in 2024 (30.2%) and 2023 (34.7%), it was higher than the average increase of 22.1% in 2022 for the same group of counties. Fundamentally, the data shown here clearly indicate that these recent large increases in housing values are best viewed as a historically anomalous short-term issue.
Part I: 2005, 2008, 2011 2014, 2017, 2020 & 2023 Reappraisal and Update Analysis
Tables 1 and 2 below provide some insight on patterns of reappraisal increases from 2005 through 2023. The 7 years shown in the table are all property reappraisal or statistical update years for the same group of 41 counties. These 41 counties are listed below.
2023 Update Counties (N=13)
Ashland, Ashtabula, Athens, Butler, Clermont, Fulton, Greene, Knox, Madison, Montgomery, Noble, Summit, Wayne
2023 Reappraisal Counties (N=28)
Auglaize, Clinton, Darke, Defiance, Delaware, Franklin, Gallia, Geauga, Hamilton, Hardin, Harrison, Henry, Jackson, Licking, Mahoning, Mercer, Morrow, Perry, Pickaway, Pike, Preble, Putnam, Richland, Seneca, Shelby, Trumbull, Van Wert, Wood
Note that the list above is exactly the same for the years 2005, 2011 and 2017. And in 2008, 2014 and 2020 the counites undergoing reappraisal in 2023 experienced the statistical update while the counties undergoing the update went through full reappraisal.
Table 1 compares the total reappraisal and update increases in Class I residential and agricultural real property value with the total increase in Class I property value from the preceding year (the other primary factor in valuation increases from one year to the next is new construction).
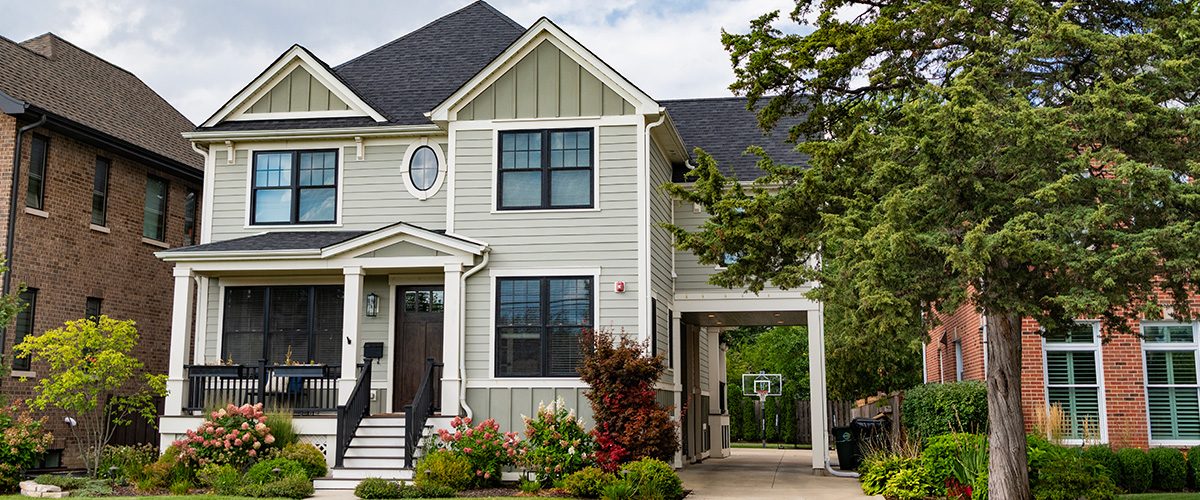
Table 1: Class I Reappraisal Increase Compared to Total Valuation Increase
The data in Table 1 clearly show how unusual a year 2023 was in terms of reappraisal increases. Class I reappraisal and update increases totaled $44.769 billion in 2023. This is 93.6% of the total increase in Class I value from FY22. Three years earlier in 2020, reappraisal increases were only $13.706 billion and were 88% of the total Class I valuation increase. In 2008 reappraisal increases were $2.099 billion and were responsible for only 57% of the total $3.680 increase in Class I value. Note that the negative change in valuation in 2011 reflects the impact of the housing market decline brought on by the 2008-09 recession.
Table 2 provides a second perspective on reappraisal increases. Table 2 shows Class I reappraisal increases and compares to the prior year Class I valuation figure to compute a percentage increase in valuation due to reappraisal. Note that the data in Table 2 is only for counties undergoing reappraisal and update in each of the 7 years included in the table.
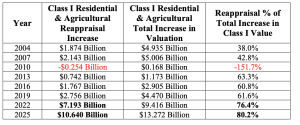
Table 2: Class I Reappraisal Increase as a Percentage of Prior Year Class I Valuation – Only Counties Going Through Reappraisal or Update
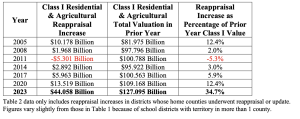
Table 2 clearly shows that the 34.7% average increase in reappraisal value in 2023 is far higher than that in any of the other years in which these counties underwent reappraisal or statistical update. This again reinforces the extent to which 2023 was an outlier in terms of Class I property reappraisal increases.
Part II: 2003, 2006, 2009, 2012, 2015, 2018, 2021 & 2024 Reappraisal and Update Analysis
Tables 3 and 4 below provide reappraisal increase data for counties undergoing reappraisal or update from 2003 through 2024. The 8 years shown in the table are all property reappraisal or statistical update years for the same group of 24 counties. These 24 counties are listed below.
2024 Update Counties (N=5)
Allen, Coshocton, Guernsey, Sandusky, Vinton
2024 Reappraisal Counties (N=19)
Belmont, Brown, Crawford, Cuyahoga, Erie, Fayette, Highland, Huron, Jefferson, Lake, Lorain, Lucas, Morgan, Muskingum, Ottawa, Portage, Stark, Warren, Williams
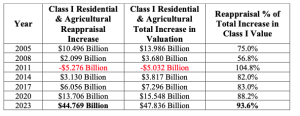
Table 3 compares the total reappraisal and update increases in Class I residential and agricultural real property value with the total increase in Class I property value from the preceding year (the other primary factor in valuation increases from one year to the next is new construction).
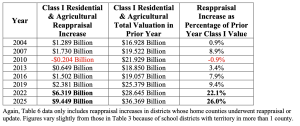
Table 3: Class I Reappraisal Increase Compared to Total Valuation Increase
As was the case in Table 1, the data in Table 3 clearly show that both 2021 and 2024 were also atypical years in terms of reappraisal increases. Class I reappraisal and update increases totaled $10.596 billion in 2021 and were 85.3% of the total Class I valuation increase. This is amount was 61% larger than the next highest reappraisal increase (2006). Three years earlier in 2018, reappraisal increases were only $5.345 billion. Furthermore, the 2024 reappraisal and update increases were substantially larger than those in 2021. Class I reappraisal and update increases totaled $24.924 billion in 2024 which was 2.35 times as large as the reappraisal increases in the same counties 3 years prior in 2021 and represented 90.3% of the total Class 1 valuation increase. Finally, the negative changes in valuation in both 2009 and 2012 reflect the impact of the housing market decline brought on by the 2008-09 recession.
Table 4 provides a second perspective on reappraisal increases just as Table 2 above did.
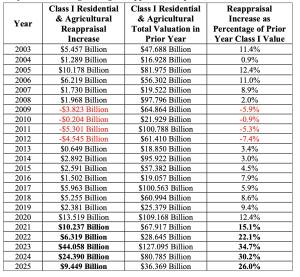
Table 4: Class I Reappraisal Increase as a Percentage of Prior Year Class I Valuation – Only Counties Going Through Reappraisal or Update
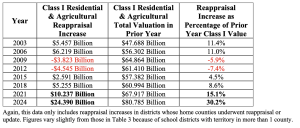
Table 4 shows Class I reappraisal increases and compares to the prior year Class I valuation figure to compute a percentage increase in valuation due to reappraisal. As was the case with Table 2, the data in Table 4 is only for counties undergoing reappraisal and update in each of the 7 years included in the table.
Table 4 shows that the 15.1% average increase in reappraisal value in 2021 was higher than that in any of the other years in which these counties underwent reappraisal or statistical update and that the 30.2% increase in 2024 was twice the size of the 2021 increase. This again reinforces the extent to which 2021 marked the beginning of the recent period characterized by historically large Class I property reappraisal increases.
Part III: 2004, 2007, 2010, 2013, 2016, 2019, 2022 & 2025 Reappraisal and Update Analysis
Tables 5 and 6 below provide some insight on patterns of reappraisal increases from 2004 through 2025. The 8 years shown in the table are all property reappraisal or statistical update years for the same group of 23 counties. These 23 counties are listed below.
2025 Update Counties (N=12)
Adams, Columbiana, Hancock, Hocking, Holmes, Lawrence, Meigs, Monroe, Paulding, Scioto, Tuscarawas, Washington
2025 Reappraisal Counties (N=11)
Carroll, Champaign, Clark, Fairfield, Logan, Marion, Medina, Miami, Ross, Union, Wyandot
Table 5 compares the total reappraisal and update increases in Class I residential and agricultural real property value with the total increase in Class I property value from the preceding year (the other primary factor in valuation increases from one year to the next is new construction).
Table 5: Class I Reappraisal Increase Compared to Total Valuation Increase
As was the case in Tables 1 and 3, the data in Table 5 clearly show that 2022 and 2025 were also atypical years in terms of reappraisal increases. Class I reappraisal and update increases totaled $7.193 billion in 2022 and $10.640 billion in 2025. The 2022 reappraisal increase was 76.4% of the total increase in Class I value from 2021 while the 2025 reappraisal increase was 80.2% of the total increase in Class 1 value from 2024. In 2019, reappraisal increases were only $2.756 billion and comprised 61.6% of the total Class I valuation increase. The reappraisal and update increases in the other 5 years shown in Table 5 were all less than the 2019 figure. Note that the negative change in valuation in 2010 reflects the impact of the housing market decline brought on by the 2008-09 recession.
Table 6 provides a second perspective on reappraisal increases just as Tables 2 and 4 above did. Table 6 shows Class I reappraisal increases and compares to the prior year Class I valuation figure to compute a percentage increase in valuation due to reappraisal. Note that the data in Table 6 is only for counties undergoing reappraisal and update in each of the 8 years included in the table.
Table 6: Class I Reappraisal Increase as a Percentage of Prior Year Class I Valuation – Only Counties Going Through Reappraisal or Update
As was the case in Tables 2 and 4, Table 6 clearly shows that both the 22.1% average increase in reappraisal value in 2022 and the 26.0% reappraisal increase in 2025 were far higher than that in any of the other years in which these counties underwent reappraisal or statistical update. This again reinforces the extent to which recent years have been outliers in terms of Class I property reappraisal increases. Table 7 on the following page combines the data shown in Tables 2, 4 and 6 and provides a summary of reappraisal increases over the 23-year period from 2003 through 2025.
Table 7 shows that while the average percentage of reappraisal increase has been increasing since 2017, it is only since 2022 that the average percentage increase has been far outside historical norms over the past 23 years.
Table 7: Class I Reappraisal Increase as a Percentage of Prior Year Class I Valuation – Only Counties Going Through Reappraisal or Update, 2003-2025
Part IV: Ohio Department of Taxation Alteration of County Reappraisal Schedule
In January 2026 the Ohio Department of Taxation released a revised county reappraisal schedule that modified the timing of the next property reappraisal for 16 of Ohio’s 88 counties. The Tax Department’s change was consistent with recommendation #14 made by Governor DeWine’s Property Tax Working Group which convened in summer 2025. The working group noted “that equity is a key component to property tax relief” and recommended “that the Department of Taxation rearrange when counties experience their sexennial reappraisal and triennial update to provide this balance and equity for Ohio’s taxpayers”. The Tax Department made the following changes to the property reappraisal schedule:
- Lucas County reappraisal update in 2027 is delayed to a full reappraisal in 2028.
- Clinton, Delaware, Franklin, Geauga, Hamilton, Jackson, Mahoning, Mercer, Morrow, and Pike county reappraisals are delayed by one year from 2029 to 2030.
- Crawford, Cuyahoga, Lake, Muskingum and Stark county reappraisals are delayed by one year from 2030 to 2031.
The revised 2026 to 2031 property reappraisal and update schedule can be found at: https://tax.ohio.gov/government/real-state/reappraisal-and-triennial-update