At this point in time, even the most casual observer of state and local government finance is no doubt aware of the significant negative impact that the COVID-19 pandemic and the related contraction of Ohio’s economy have had on the state’s General Revenue Fund (GRF) tax revenues. At the end of February (2/3rd of the way through FY20), state GRF tax receipts were $249 million above estimate. February was the last full month before the pandemic-related stay-at-home and business shut-down orders were issued by Governor Mike DeWine. Over the four month “Covid-contraction” period from March-June 2020, state GRF tax revenues were $1.348 billion below estimates. Adjusting for the fact that roughly $80 million of the revenue shortfall relative to estimated levels was the result of early payment of foreign insurance taxes in February, the March-June pandemic time frame resulted in a reduction of expected state tax revenue of $1.270 billion. Furthermore, this reduction was entirely attributable to a combined $1.3 billion reduction in state sales and income tax receipts over the four-month March-June time period. The net effect of this shortfall was that final GRF tax revenues for FY20 were $1.099 billion below estimate.
Table 1 below provides an overview of state income tax and sales tax revenues in FY20, with an emphasis on the March-June time frame. (Note that non-auto and auto sales are combined in Table 1 due to space constraints even though OBM typically reports them separately.)
Table 1: FY20 March-June GRF Sales Tax & Income Tax Revenues: ($ in Millions)
| Month | Sales Tax Estimate | Sales Tax Actual | Difference | Income Tax Estimate | Income Tax Actual | Difference |
| July-Feb. Subtotal | $7,272.0 | $7,417.4 | $145.4 | $5,608.0 | $5,590.4 | -$17.6 |
| March | $819.5 | $751.5 | -$68.0 | $438.8 | $416.5 | -$22.3 |
| April | $984.6 | $747.9 | -$236.7 | $1,258.0 | $622.2 | -$635.7 |
| May | $949.8 | $782.5 | -$167.3 | $605.1 | $513.7 | -$91.4 |
| June | $987.9 | $986.5 | -$1.4 | $816.5 | $738.5 | -$78.0 |
| March -June Total | $3,741.8 | $3,268.4 | -$473.4 | $3,118.4 | $2,290.9 | -$827.5 |
| 4 Month % Reduction | -12.7% | -26.5% |
The top row of Table 1 shows that through the first eight months of FY20 auto and non-auto sales tax revenues were a combined $145.4 million (2.0%) ahead of estimate, while personal income tax revenue was $17.6 million (-0.3%) below estimate. However, the remainder of Table 1 shows that from March-June, sales tax revenues were $473.4 million (12.7%) below estimate and income tax revenues were $827.5 million (26.5%) below estimate. Adding these two figures results in a total loss of expected sales and income tax revenue over the final four months of FY20 of $1.301 billion. (While not shown in Table 1, non-auto sales tax revenue was $381.8 million below estimate from March- June while auto sales tax revenue was $91.6 million below estimate, which add up to the sales tax total of $473.4 million below estimate.)
Table 2 reports actual vs. estimated FY20 GRF tax revenues for each state tax and shows that total FY20 state tax revenues fell short of estimated revenues by $1.009 billion. This tax revenue loss, combined with the decision not to tap into the state’s $2.7 billion Rainy Day fund in FY20, was what necessitated the $775 million in budget cuts implemented by Governor DeWine in May.
Table 2: FY20 Final General Revenue Fund Tax Revenues: ($ in Millions)
| GRF Tax | Actual Revenue | Estimated Revenue | Difference |
| Non-Auto Sales Tax | $9,183 | $9,466 | ($283) |
| Auto Sales Tax | $1,503 | $1,548 | ($45) |
| Income Tax | $7,881 | $8,726 | ($845) |
| Commercial Activity Tax | $1,672 | $1,639 | $33 |
| Cigarette Tax | $913 | $892 | $21 |
| Kilowatt Hour Tax | $332 | $335 | ($3) |
| Foreign Insurance Tax | $305 | $292 | $13 |
| Domestic Insurance Tax | $303 | $301 | $2 |
| Financial Institutions Tax | $215 | $190 | $25 |
| Public Utility Excise Tax | $141 | $140 | $1 |
| Natural Gas MCF Tax | $60 | $78 | ($18) |
| Alcoholic Beverage Tax | $54 | $56 | ($2) |
| Liquor Gallonage Tax | $53 | $50 | $3 |
| Petroleum Activity Tax | $9 | $10 | ($1) |
| Total GRF Taxes | $22,623 | $23,722 | ($1,099) |
Table 2 shows that the net result of the $473.4 million in lost sales tax revenue over the last four months of the fiscal year meant that total sales tax revenues went from $145.4 million above estimate through February to $328.0 million ($283 +$45) below estimate through June.
The Delay of the Income Tax Filing Date
To completely understand the figures shown in Table 2 it is necessary to understand the impact of the decision to delay the filing date for state income taxes. In order to avoid requiring Ohio taxpayers to make final income tax payments for 2019 and estimated tax payments for 2020 while in the midst of the impact of the pandemic, the state of Ohio agreed to match the Federal government’s decision to delay the income tax filing date from April 15th to July 15th. This delay meant that income tax returns for 2019 and estimated tax payments for 2020 did not need to be filed in FY20, as July is the first month of the FY21 fiscal year. Analysis of income tax data showing April 2020 estimated and annual return tax payments and comparison with 2019 figures suggests that roughly $530 million of the $827.5 million reduction in income tax revenues from March-June was due to the delay of the filing date from April to July. This meant that an estimated $297.5 million (9.5%) in expected income tax revenue was lost from March through June as a result of the Covid-19 pandemic. ($827.5 million reduction in revenues – $530 million lost due to filing date change = $297.5 million lost due to Covid impact).
FY21 GRF Estimated Tax Revenues
As result of the $1.1 billion Covid-driven reduction in FY20 GRF tax revenues discussed above, the Office of Budget and Management (OBM) revised its FY21 GRF tax revenue estimates downward in May. The revised FY21 tax revenue estimates are roughly $2.3 billion lower than the original FY21 estimates from July 2019. FY21 revenue estimates were revised downward as follows:
- Non-auto sales tax revenues were lowered by $1.249 billion (-13.0%)
- Auto sales tax revenues were lowered by $220 million (-13.8%)
- Personal income tax revenues were lowered by $660 million (-7.2%)
- Commercial Activity tax revenues were lowered by $163 million (-9.9%)
Table 3 provides a comparison of the original July 2019 FY21 tax revenue estimates with the revised May 2020 FY21 tax revenue estimates.
Table 3: FY21 Revised GRF Tax Revenue Estimates: ($ in Millions)
| GRF Tax | July 2019 Revenue Estimate | May 2020 Revenue Estimate | Reduction Amount | % Reduction |
| Non-Auto Sales Tax | $9,589 | $8,340 | -$1,249 | -13.0% |
| Auto Sales Tax | $1,592 | $1,372 | -$220 | -13.8% |
| Sales Tax Total | $11,181 | $9,712 | -$1,469 | -13.1% |
| Income Tax | $9,187 | $8,527 | -$660 | -7.2% |
| Commercial Activity Tax | $1,653 | $1,490 | -$163 | -9.9% |
| All Other Taxes | $2,329 | $2,329 | $0 | — |
| Total GRF Tax Revenue | $24,350 | $22,058 | -$2,292 | -9.4% |
Note that the revised sales tax revenue estimate of $9.712 billion would be the lowest collection total for Ohio’s sales tax since FY14.
Note also that the personal income tax revenue estimate includes the roughly $530 million in additional revenue (less refunds owed) that OBM expected to see in July that would normally have been collected in April but was not due until July 15th due to the filing deadline delay. This means that the “baseline” personal income tax reduction is really -$1,190 million (-13.0%). Explained another way, if not for the $530 million in additional revenues that is expected to be received in FY21only because of the income tax filing date change, the $660 million reduction from Table 3 would really be $1,190 million ($660 + $530 = $1,190). Also, if the income tax revenue collected in July that would normally have been owed in April is included in the FY20 total (where it would have accrued without the delay in the filing deadline), the FY21 income tax revenue estimate would be the lowest collection total since FY17.
FY07-FY21 GRF Tax Revenues
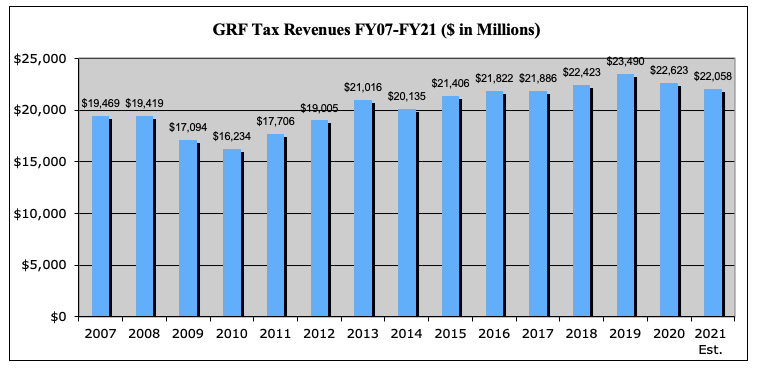
Figure 1 below provides an overview of Ohio GRF tax revenues from FY07 through FY21. Figure 1 shows that the $22.058 billion in GRF tax revenues estimated for the FY21 fiscal year is only a $172 million (0.8%) increase over the $21.886 billion in GRF taxes collected in FY17.
Figure 1: FY07-FY21 Actual and Estimated GRF Tax Revenues
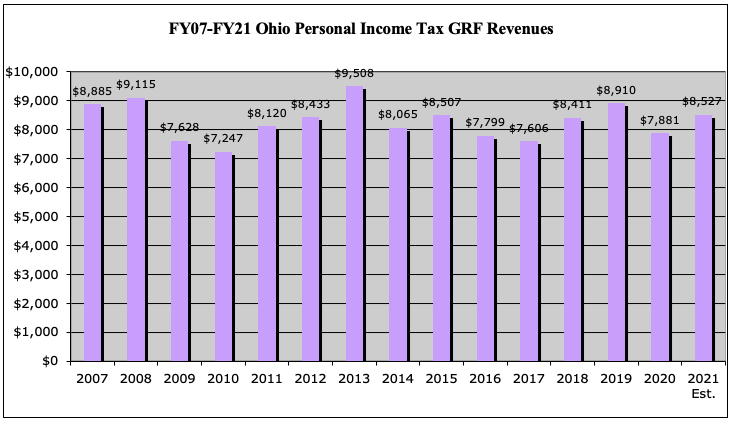
Figures 2 and 3 below show actual and estimated income tax and sales tax revenues from FY07-FY21.
Figure 2: FY07-FY21 Sales Tax Revenues
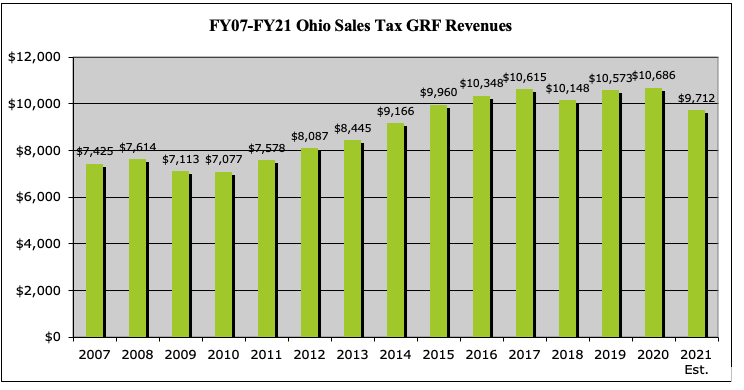
Figure 3: FY07-FY21 Income Tax Revenues