Part I: Net state funding for schools from FY11-FY21
Foundation formula aid and TPP replacement payments are the two primary forms of general-purpose state funding provided to Ohio’s 609 K-12 school districts and 49 Joint Vocational School Districts (JVSDs) and Career Technical Centers (CTCs). This analysis summarizes changes in Ohio K-12 public school foundation formula funding and Tangible Personal Property (TPP) replacement payments from FY11 through FY24. FY11 serves as the base year for this analysis for two reasons. First, FY11 was the last year before TPP replacements began to be phased out. Second, FY11 reflects the last year in which Federal stimulus payments were required to help pay for the school foundation formula in the aftermath of significantly reduced state tax revenues resulting from the impact of the 2008-09 recession. In that manner FY11 reflects the last year of the severest impact of the recession, while FY12 and beyond reflect state spending in more “normal” economic circumstances (at least until FY20 when the COVID pandemic occurred).
One complication in preparing this analysis is that Ohio’s method for funding the state’s 300+ community schools, which also funds the EdChoice, Cleveland, Autism and Jon Peterson Special Needs voucher programs, was changed beginning with the FY22 school year. From their inception in FY99 through FY21, Ohio’s community schools were funded through a method whereby community school students were included in the student count of the school district in which they lived, which meant that those students contributed to each district’s state share of foundation formula funding as computed on the SFPR. Then funding for community schools was deducted from the district’s total state aid amount in accordance with the community school funding formula. The same was true for the EdChoice Autism and Peterson Special Needs voucher programs.
However, beginning in FY22, the deduction method of funding community schools and vouchers in Ohio was eliminated and replaced with direct state funding for these programs. (Note that the EdChoice Expansion voucher program was directly funded by the state since its inception in FY14 and the Cleveland voucher program was a mixture of the two approaches.) As a result of this policy change, in order to provide an “apples to apples” comparison of state foundation formula funding to that of FY22, FY23 and FY24, it is necessary for the FY11-FY21 state foundation aid payments shown here to reflect actual funding amounts provided to the 609 K-12 school districts after the community school and voucher deductions have been applied. This approach also provides a more accurate reflection of state aid payments that were actually received by Ohio’s traditional public school districts than would be found by tracking FY11-FY21 state funding levels that include community school and voucher program funding.
Table 1 shows the process of adjusting the SFPR foundation payment data for the community school and voucher deductions from FY11 through FY21. The data in the top row of Table 1 shows state foundation formula funding prior to the community school and voucher deductions. Note that in FY11 $515.5 million in federal stimulus funding was used to fund the foundation formula, while the FY20 and FY21 SFPR amounts include supplemental funding provided for districts with rapid enrollment growth as well as the impact of the budget cuts imposed by Governor DeWine in May 2022 after the onset of the COVID-19 pandemic. The second row of Table 1 shows funding provided in FY20 and FY21 for Student Wellness and Success (SWS). This funding was provided on top of formula aid in these years.
Rows 3 and 4 of Table 1 show the community school and voucher deduction amounts, respectively, in each year from FY11 through FY21. The bottom row of Table 1 shows the net funding received by the 609 traditional K-12 school districts from FY11-FY21.
Table 1: FY11-FY21 School District Foundation Formula Aid Before and After the Community School & Voucher Deductions ($ in Millions)
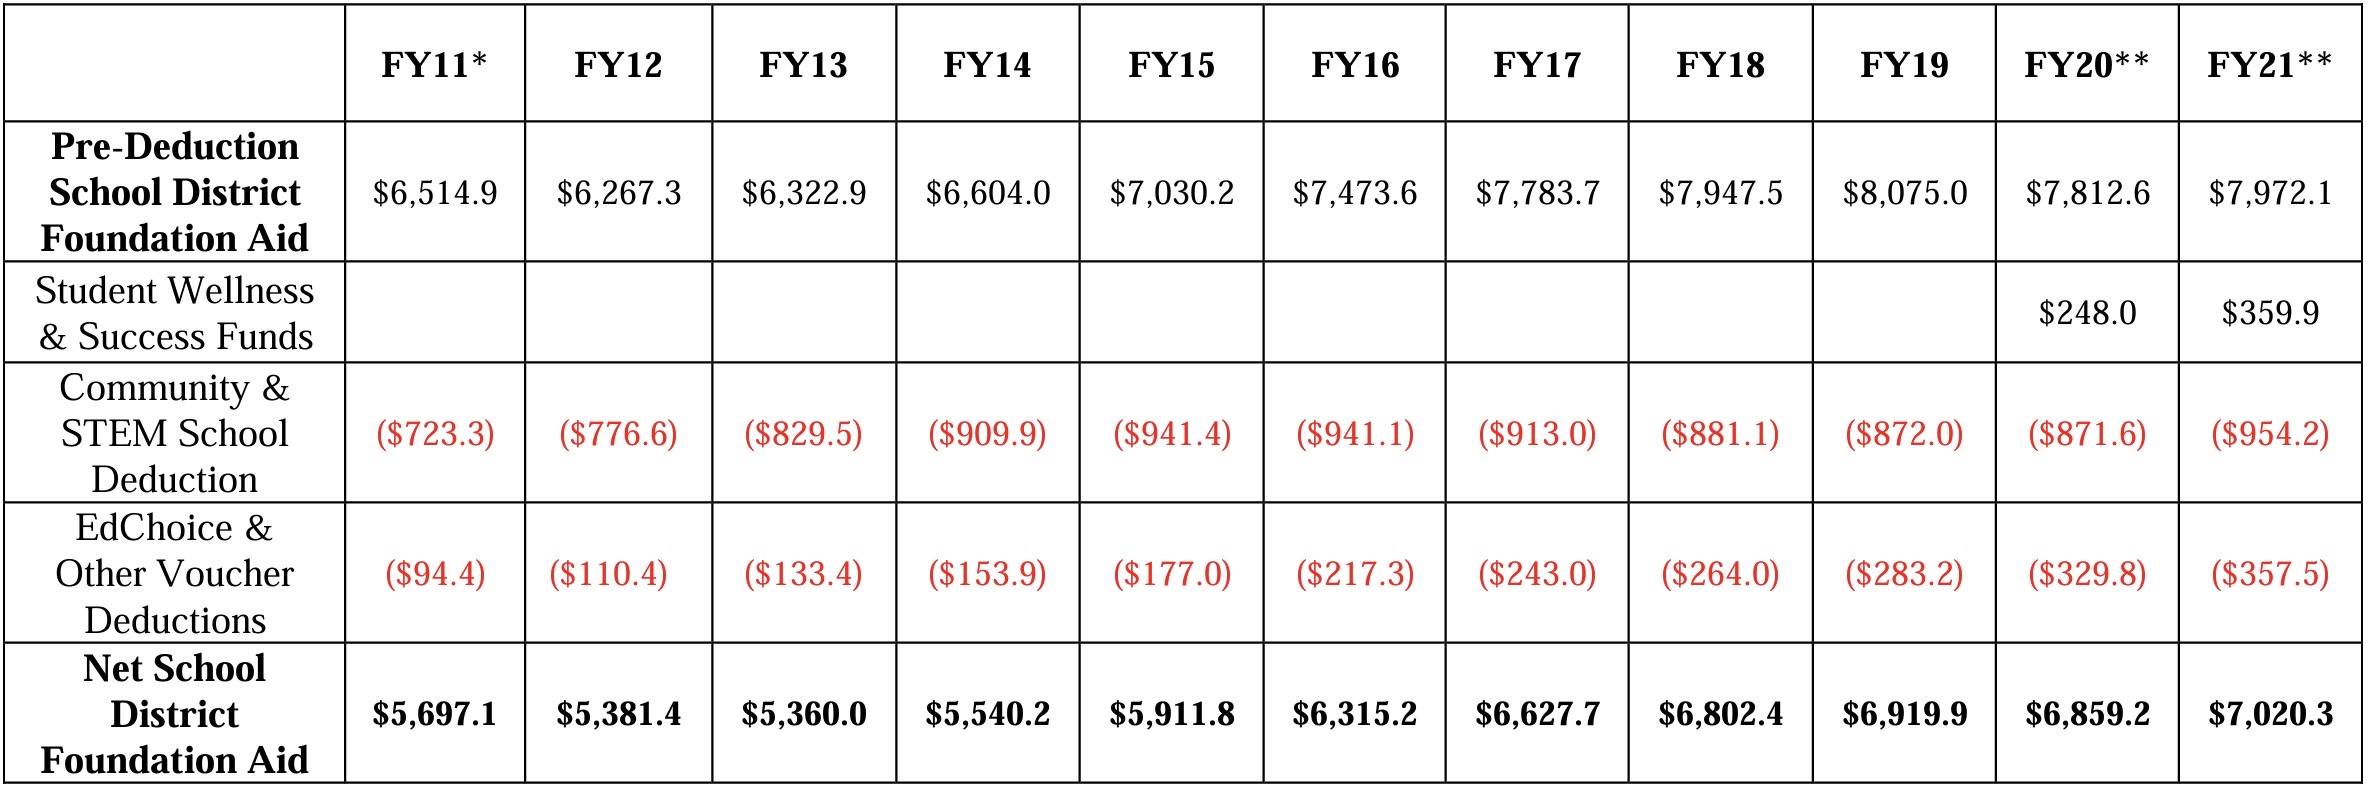
** FY20 Foundation Formula Aid amount includes $15.5 million in enrollment growth aid as well as the $277.2 million reduction in formula aid made in May and June 2022 due to the COVID-19 pandemic, while FY21 funding includes $23 million in enrollment growth funds and reflects $125.2 million in reduced funding to school districts from the 2020 COVID-19 budget cuts.
Table 1 shows that foundation formula funding for Ohio’s traditional K-12 school districts fell by 5.5% from FY11 to FY12 as the state fiscally retrenched after the 200809 recession, fell slightly again in FY13, and then increased each year until FY20 when the COVID-19 budget cuts were imposed. Note that Table 7 at the end of this report shows community school and total voucher program funding from FY11 through FY24.
Part II: State tax reform and tangible personal property tax replacement payments
From the late 1990s to the mid 2000s Ohio made a series of state tax policy changes which resulted in the reduction and/or elimination of a significant amount of local property taxes received by Ohio schools and local governments.
- The first change was the passage of Senate Bill (SB) 3 in 1999. SB 3 was governed the deregulation of Ohio’s electricity industry. This legislation lowered the assessment percentage of all electric and rural electric public utility tangible personal property (PUTPP), except for that used in the transmission and distribution of electricity, to 25% of true value. Prior to this change electricity generation property was assessed at 100% of true value, transmission and distribution and other electric TPP was at 88% of true value, and rural electric company property was assessed at 50% of true value. This reduction in the assessment percentage occurred because the deregulation of the electricity generation industry meant that public utilities and nonutilities would be competing with one another and the assessment percentage of tangible personal property (TPP) of non-utility businesses was already established at 25% of true value. PUTPP used in the transmission and distribution of electricity remained at 88%. This change in the PUTPP assessment percentage on electricity generation property was effective January 1, 2001.
- The second change came when SB 287 passed in 2000. SB 287 was the legislation which governed the deregulation of the natural gas industry in Ohio. This legislation lowered the assessment percentage of natural gas PUTPP from 88% to 25% for the same reasons of competitiveness that governed the assessment percentage reductions in the electricity industry. SB 287 also took effect on January 1, 2001.
- The third change was the passage of House Bill (HB) 66 in 2005. HB 66 was the FY06-07 state budget bill. It included a series of comprehensive changes to Ohio’s state and local tax system. HB 66 tax reforms included a 21% reduction in the state personal income tax rates, establishment of a new permanent state sales tax rate of 5.5%, and elimination of the state corporate franchise tax. HB 66 also called for the phaseout of the local tax on general business tangible personal property (TPP) over a three-year period from 2006 through 2008. General business TPP included business machinery and equipment; inventory; and furniture and fixtures.
All three of these tax policy changes negatively impacted Ohio’s schools and local governments because both the general business TPP tax and the PUTPP tax are local taxes. According to the Ohio Department of Taxation 2002 Annual report, PUTPP tax revenue decreased by $245 million from 2000 to 2001 — 2001 being the first year that electricity and natural gas deregulation (and the attendant reductions in the assessment percentages) took effect.
Similarly, the business tangible personal property tax generated $1.696 billion in revenue for schools and local governments in Ohio in 2005, with the school share at slightly more than $1.2 billion. By 2009 TPP tax revenue had fallen to only $55 million.
In order to ease the impact of the reductions in PUTPP taxes and the elimination of the business TPP tax on Ohio’s schools and local governments, SB 3, SB 287 and HB 66 also provided TPP replacement payments meant to initially hold harmless schools and local governments for the lost local tax revenue, followed by a phase out of these replacement payments. The phaseout schedules for both the PUTPP and TPP property tax replacement payments have been modified multiple times from their original incarnations. In FY16, PUTPP replacement payments were combined with TPP replacement payments and in FY18 all remaining TPP replacement payments were placed on a new permanent phase-out schedule which was passed in SB 208 in 2017.
HB 66’s elimination of the local business TPP tax and the state corporate franchise tax was accompanied by the creation of the state Commercial Activity Tax (CAT). CAT revenues were initially dedicated to funding the TPP replacement payments to schools and local governments, for which a phaseout was planned for 2018. After that point, 70% of CAT revenue was earmarked to generate funding for school districts in perpetuity, although the allocation formula for that funding was never specified. However, the change to the phaseout schedule of the TPP payments meant that the promised earmarking of CAT revenues to schools was also abandoned. By FY18, 85% of CAT revenues were deposited in the state General Revenue Fund (GRF), and as of FY24 all CAT revenues are deposited into the GRF.
In FY05, the first year for which data could be found, 602 school districts received $106.9 million in utility deregulation PUTPP replacement payments. By FY10 the TPP replacement payment amount had been reduced to $74 million and only 181 districts were receiving payments. By FY13 the total amount of PUTPP replacement payments was down to $27.1 million, with five school districts receiving a total of $23.5 million in replacement payments for lost operating revenue and 100 school districts receiving $3.6 million in payments for lost tax revenue on debt levies. In addition, Ohio’s 49 JVSDs also received PUTPP replacement payments. As mentioned above, in FY16 PUTPP replacement payments were combined with TPP replacement payments.
Tables 2 and 3 provide a summary of PUTPP replacement payments from FY11 through FY15.
Table 2: Utility Deregulation PUTPP Replacement Payments to K-12 School Districts, FY11-FY15 ($ in Millions)
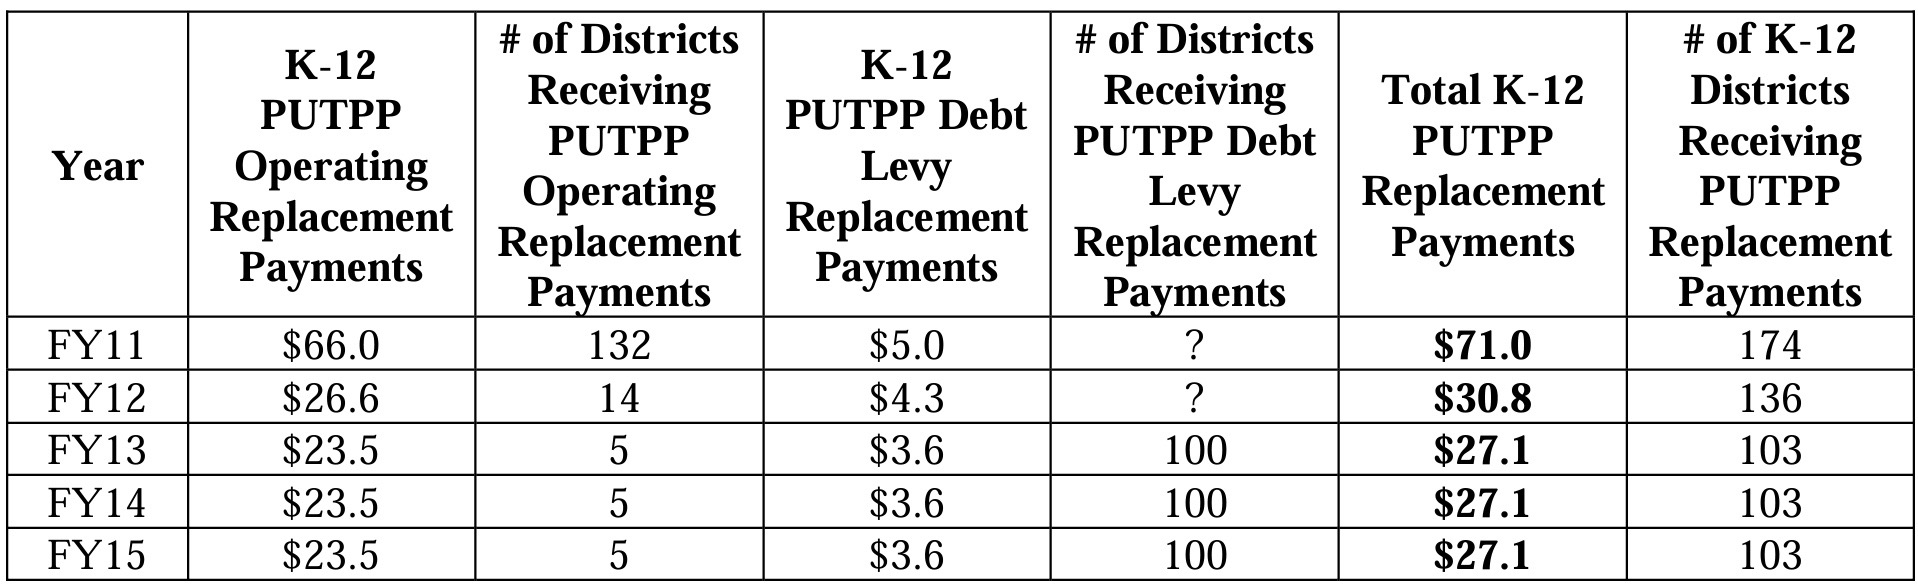
Table 3: Utility Deregulation PUTPP Replacement Payments to K-12 School Districts and JVSDs, FY11-FY15 ($ in Millions)
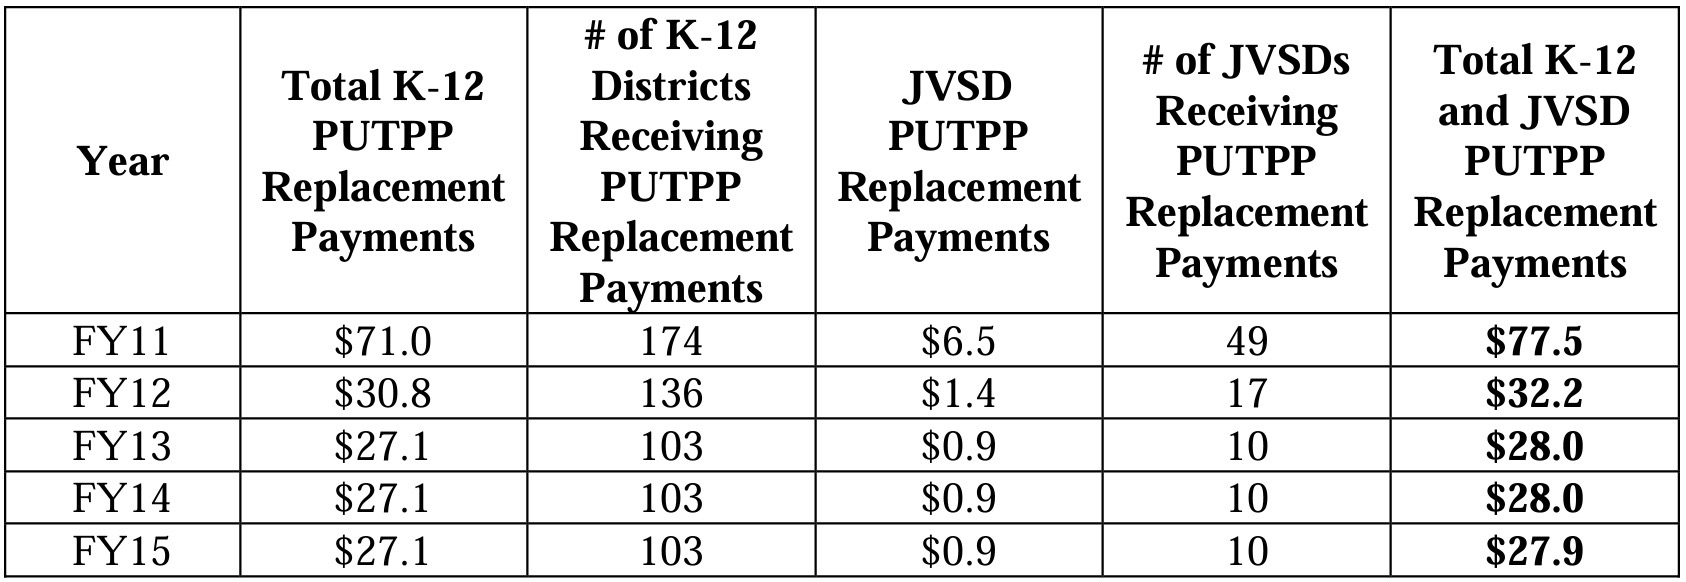
Table 4 provides a summary of TPP replacement payments from FY11 through FY25 due to the repeal of the tangible personal property tax on business property under HB 66.
Table 4: HB 66 TPP Replacement Payments by Type of Levy to K-12 School Districts, FY11-FY25 ($ in Millions)
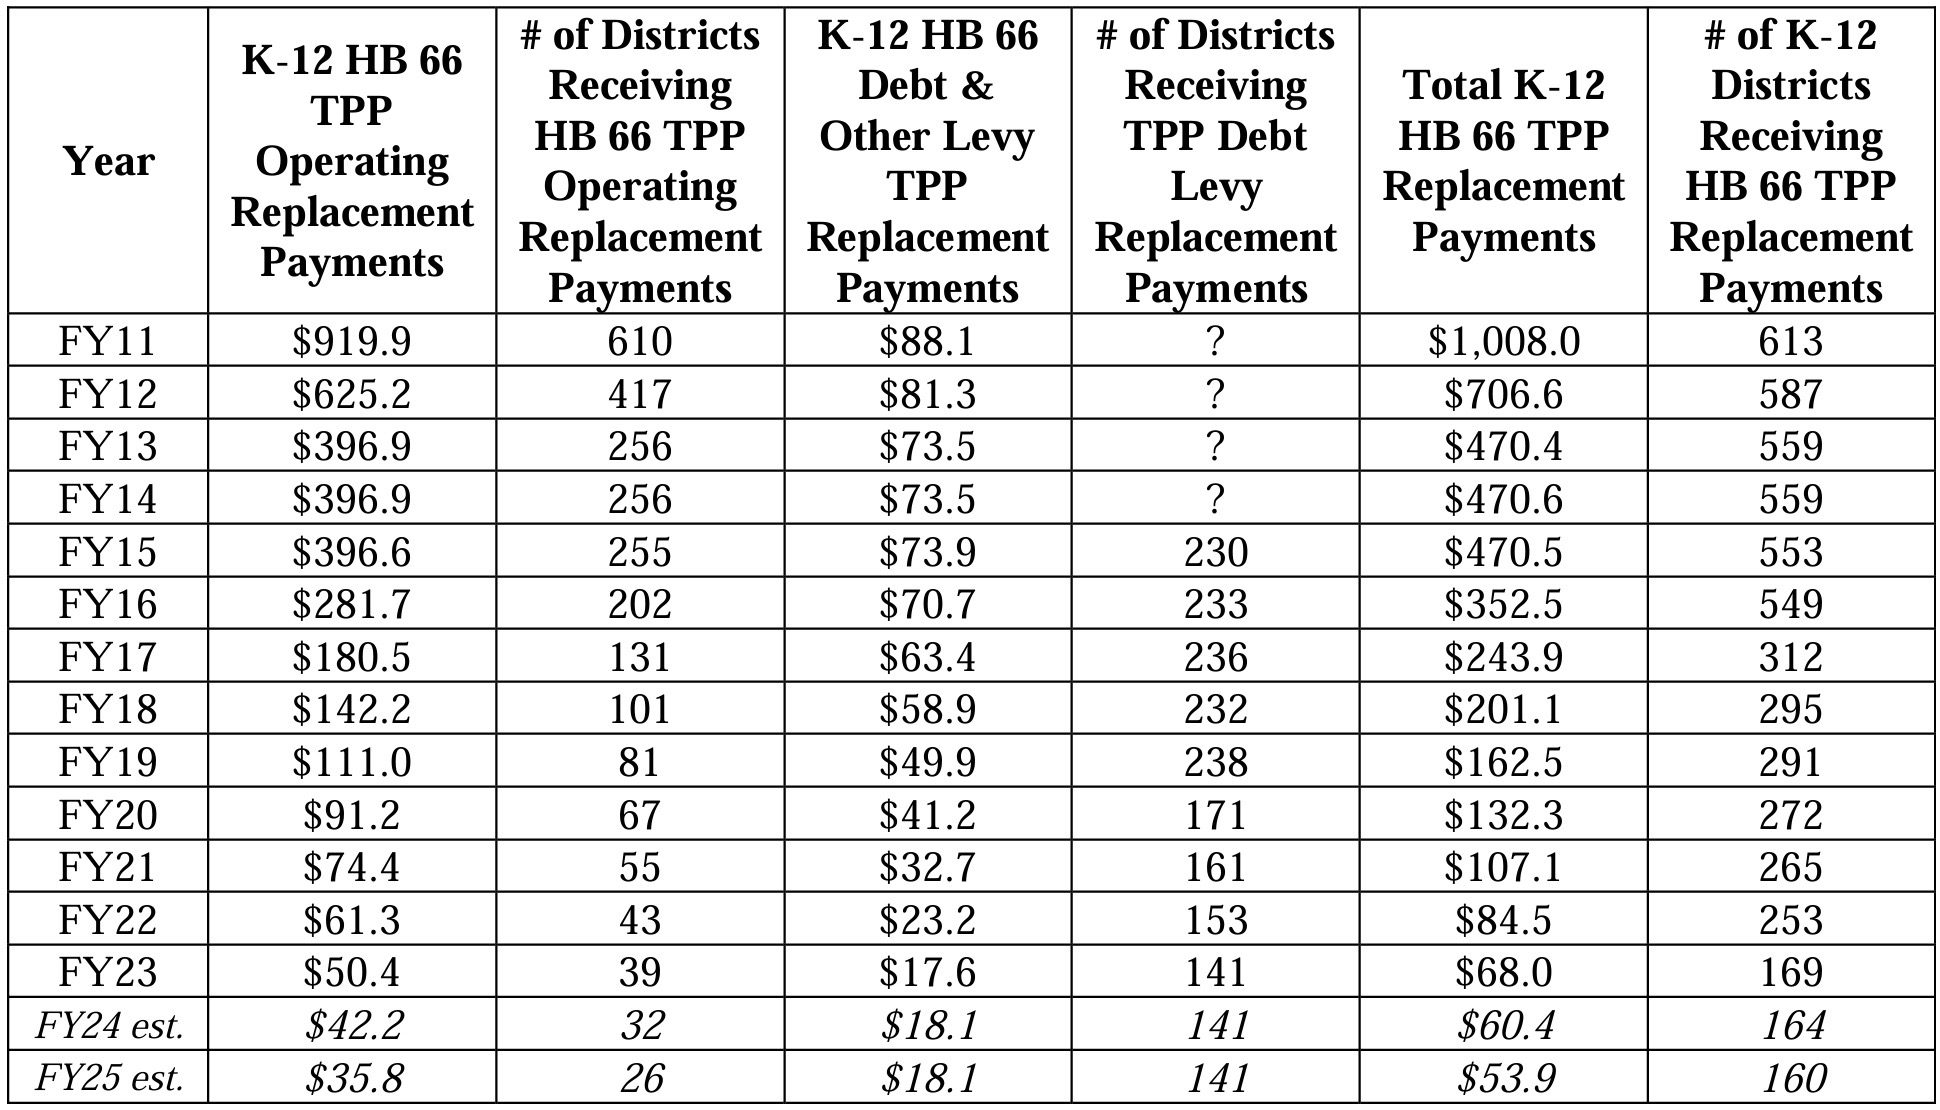
Table 4 shows that in FY11 $1.008 billion was paid to all 613 school districts to replace lost local tax revenue from the repeal of the business TPP tax under HB 66. $920 million (91.3%) of these payments were for tax revenue losses from fixed rate current expense operating levies. The remaining $88 million in TPP replacement payments in FY11 was for tax losses from emergency school levies, permanent improvement (PI) levies and debt levies.
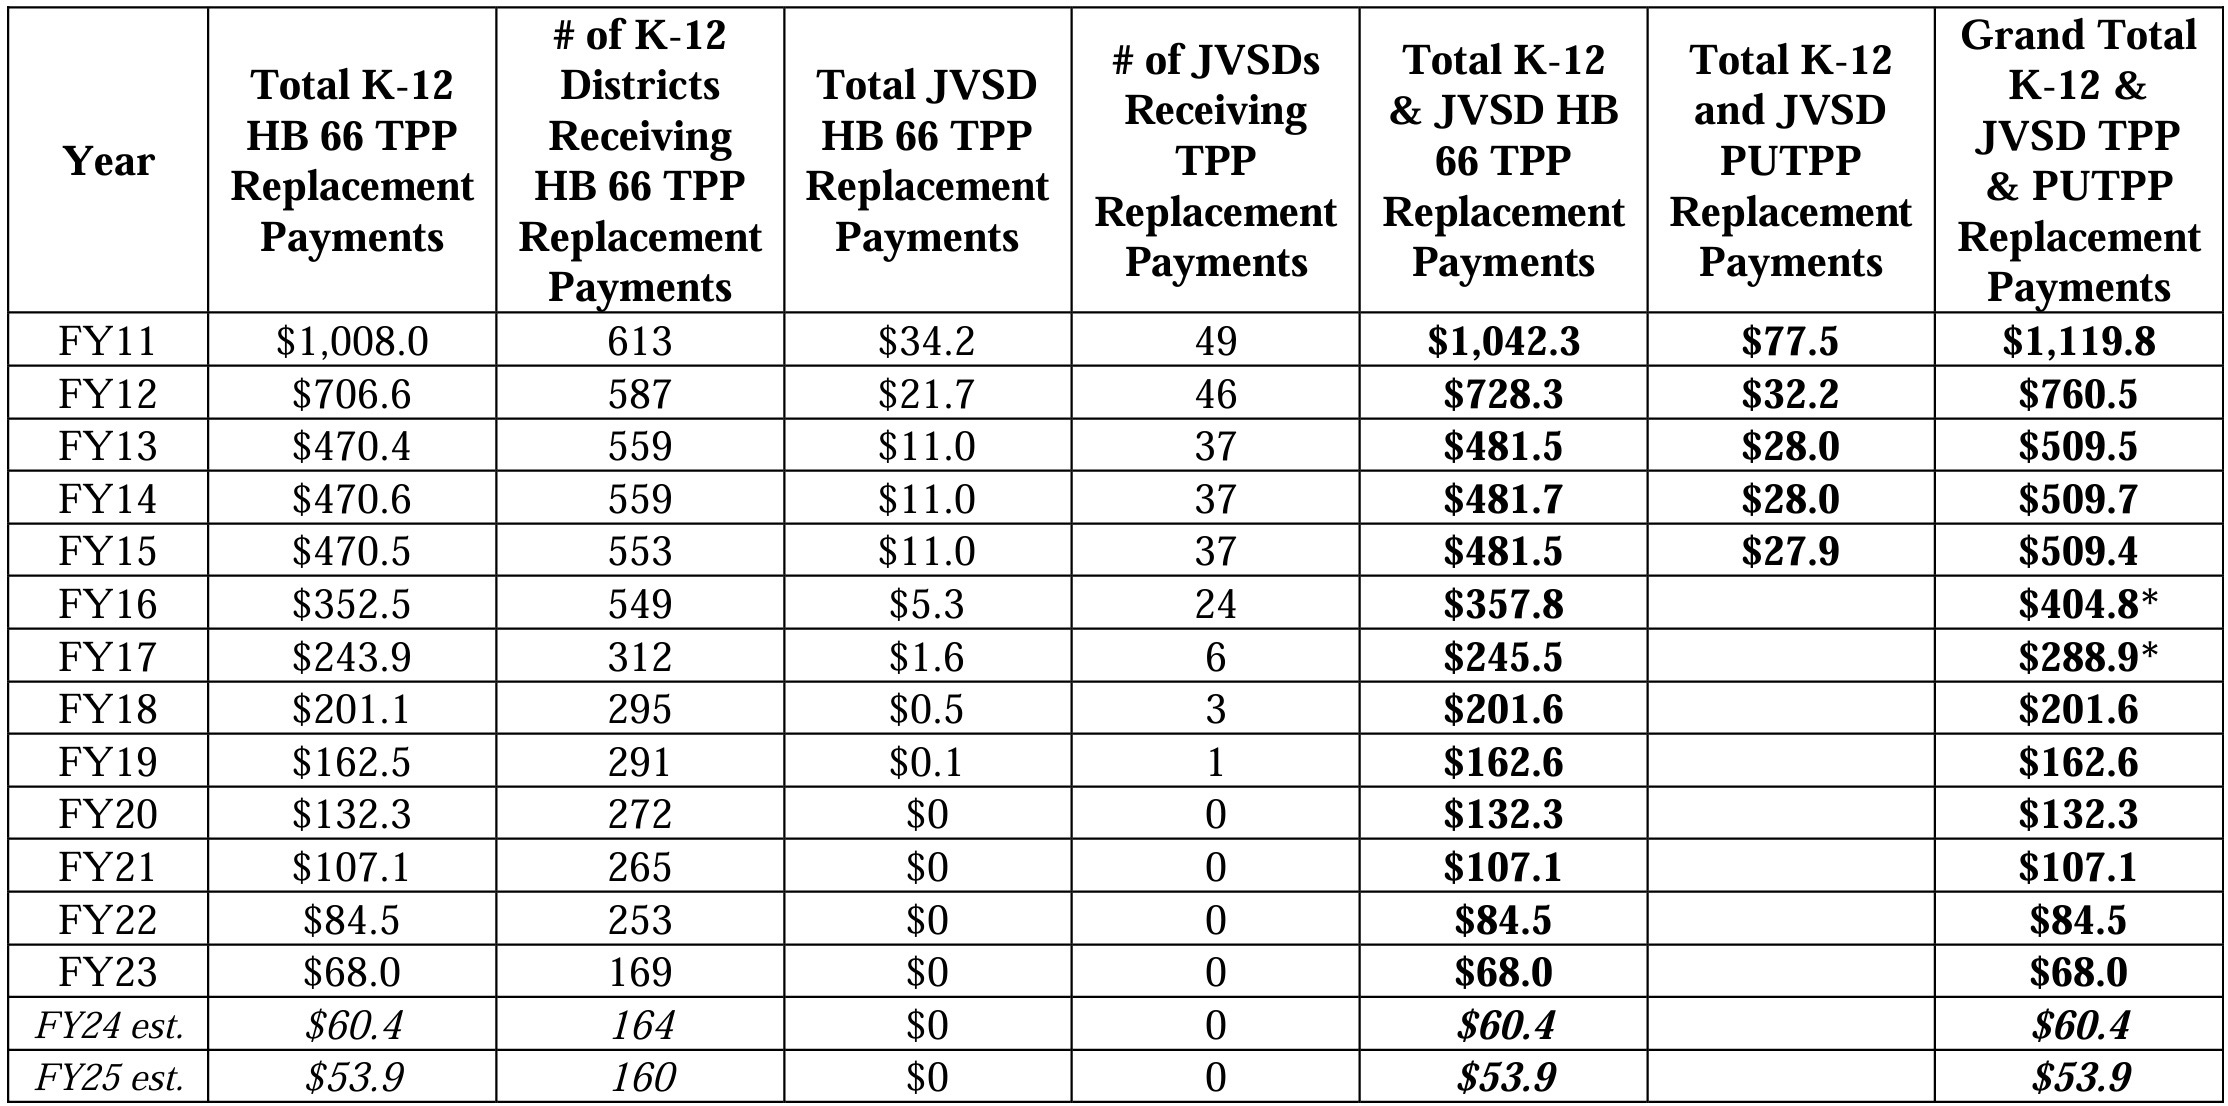
Table 5 below shows TPP replacement payments for Ohio’s K-12 school districts from FY11- FY25 along with TPP replacement payments made to Ohio’s 49 JVSDs from FY11 through FY19. In addition, Table 5 also includes the PUTPP replacement payment totals for FY11 through FY15 shown in Table 3 above. The rightmost column of Table 5 provides a grand total of TPP and PUTPP replacement payments made to Ohio’s K-12 school districts and JVSDs from FY11 through FY25.
Table 5 shows that in FY11 the TPP replacement payment total for school districts and JVSDs was $1.042 billion. When $77.5 million in SB 3 PUTPP replacement payments are included, the grand total amount of tangible personal property tax replacement payments made to Ohio’s K-12 school districts and JVSDs was $1.120 billion in FY11. By FY24 ODE estimates that this amount will have decreased to $60.4 million, a reduction of 94.6%.
Table 5: HB 66 TPP Replacement Payments to K-12 School Districts and JVSDs, FY11-FY25 ($ in Millions)
Part III: Analysis of State K-12 Education Funding Changes from FY11 to FY24
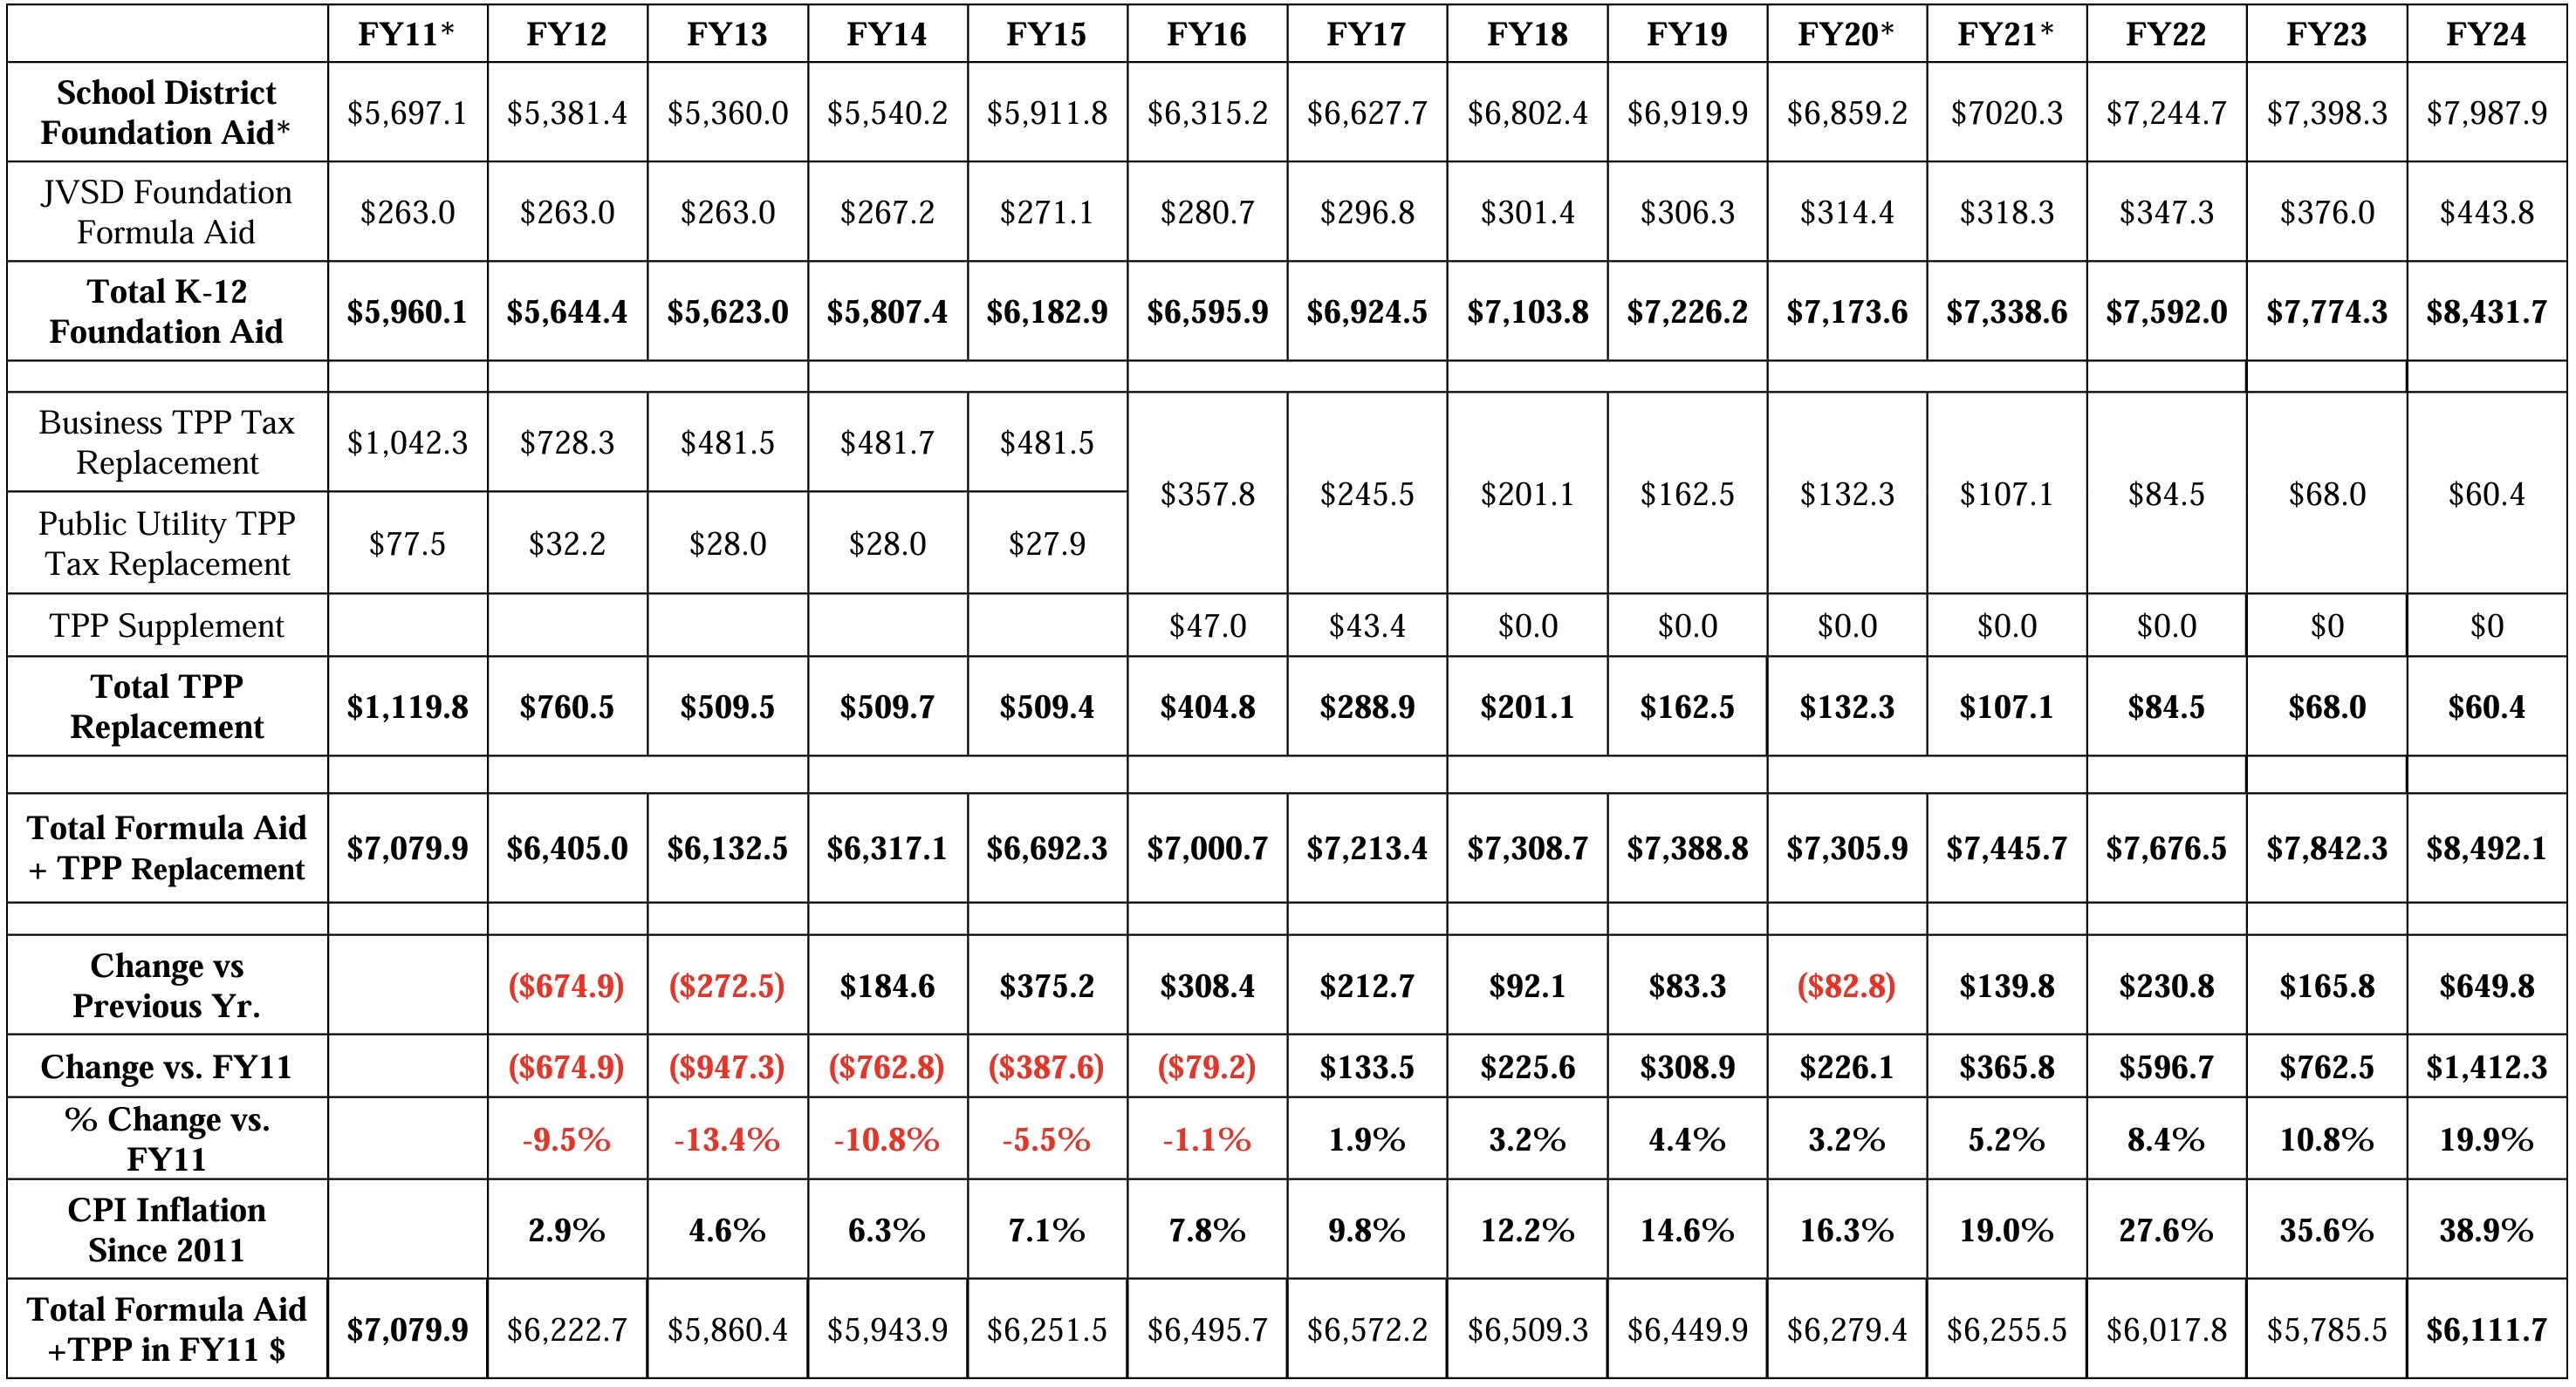
Table 6 combines the data shown in Parts I and II of this report. The top row of Table 6 shows state foundation formula funding for Ohio’s 609 K-12 school districts from FY11 through FY24. The funding amounts from FY11-FY21 are after the community school and voucher deductions have been made and the same as those shown in the bottom row of Table 1. As mentioned above, the community school and voucher deductions were eliminated beginning in FY22, and the FY22-FY24 state aid figures are taken directly from the ODE school finance payment reports for each year.
The second row of Table 6 shows foundation funding from FY11-FY24 for Ohio’s 49 JVSDs and row 3 shows the combined total K-12 district and JVSD formula funding over the FY11-FY24 time frame.
The data in row 3 of Table 6 shows that after foundation formula funding decreased in FY12 and FY13, funding increased in the aggregate each year from FY14 through FY19. Foundation formula funding decreased in FY20 due to $277 million in budget reductions due to the COVID-19 pandemic. $152 million of the FY20 reductions were reinstated in January 2021 for a net reduction of $125 million in FY21 from FY19 levels. Total district and JVSD foundation formula funding has continued to increase in FY22, FY23 and FY24 as the Fair School Funding Plan has been phased in.
Rows 4-7 of Table 6 show the general business and public utility tangible personal property (TPP) tax replacement payments made to Ohio school districts to offset the repeal and reduction of these local taxes in previous years. These figures are those shown in Table 4 above. This data shows that during the FY11-FY24 timeframe, there were more than $1 billion in reductions in TPP replacement payments to school districts, which significantly undercuts the impact of the foundation formula funding increases shown in the top 3 rows of Table 6.
Row 8 of Table 6 provides total state foundation formula funding plus TPP replacement payments for the 609 traditional school districts and 49 JVSDs in Ohio. Row 9 shows the year to year change in total formula plus TPP funding, indicating that total funding has increased every year with the exception of FY12, FY13 and FY20.
Rows 9, 10 and 11 are in many respects the most important rows in Table 6. Row 9 shows the annual change in total formula plus TPP replacement funding as compared to FY11, while Row 10 shows the annual percentage change in total state funding each year as compared to FY11. Row 11 shows the rate of inflation in each year compared to FY11. 1
1 Inflation rate data is derived from the Bureau of Economic Analysis CPI-U inflation measure and is computed on a fiscal year basis (July 1 – June 30). The FY24 Inflation rate is through January 2024.
The following three points summarize the main findings upon reviewing this data:
- The impact of the phaseout of the TPP replacement payments was large enough that it was not until FY17 that formula funding had increased enough to offset the aggregate loss in TPP which began in FY12.
- Even though total FY24 formula + TPP funding is $1.412 billion higher than it was in FY11, the increase in state funding has not kept pace with inflation. The $308.9 million net increase in state funding from FY11 to FY19 (prior to the COVID-related reductions) of 4.4% was less than one third the 14.6% rate of inflation over the same time frame. Furthermore, FY21 formula + TPP funding was only $365.8 million (5.2%) higher than FY11, which is just over one-fourth of the 19% rate of inflation over that period. Note that inflation started its recent rapid increase in April 2021, three-quarters of the way through FY21, so the FY11-FY21 comparison of net state funding to inflation is only very slightly impacted by the recent high inflation rates. Another way to look at this is that state formula funding + TPP replacement has increased by 19.9% since FY11; however, this increase is only slightly more than half the 38.9% inflation rate over that time frame.
- The bottom row of Table 1 demonstrates this point in yet another way, indicating that the $8.492 billion in FY24 foundation formula aid + TPP replacement is only worth $6.112 billion in FY11 (inflation-adjusted) dollars, $968 million less than the FY11 funding total of $7.080 billion.
Part IV: Comparison of school district state aid, community school funding and voucher funding
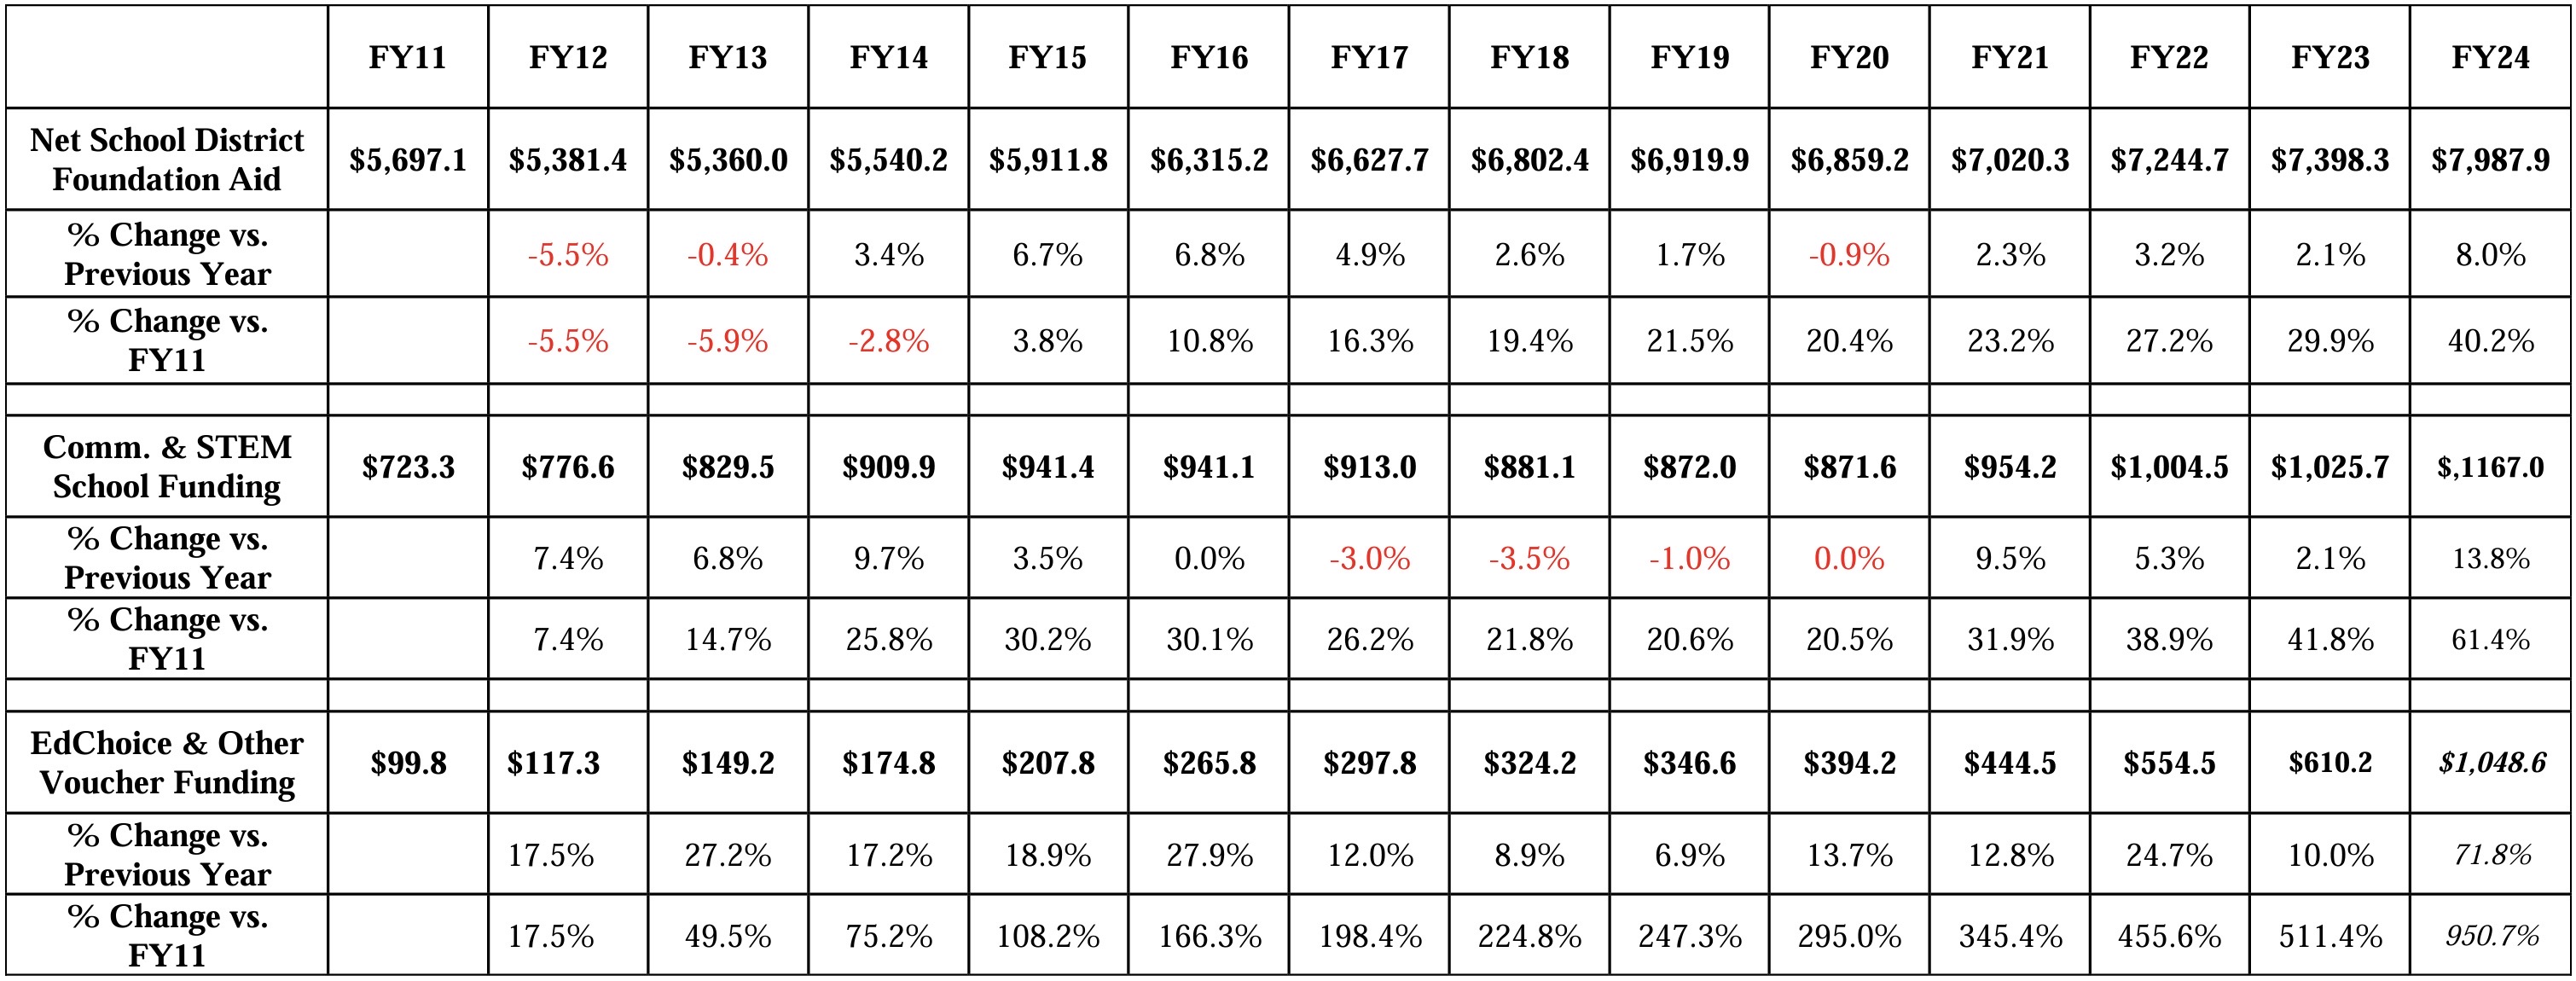
Table 7 provides a comparison — from FY11 to FY24 — of school district foundation aid (the same data shown in row 1 of Table 6), community school funding and total voucher payments for all five of Ohio’s voucher programs. The community school funding amounts from FY11 to FY21 shown in Table 7 are the same as the community school deduction amounts for those years shown in Table 1 above. Note, however, that the voucher payment figures shown in Table 7 differ from the voucher deduction amounts shown in Table 1 because the figures shown in Table 7 include the state share of Cleveland voucher program payments as well as the annual cost of EdChoice expansion which has been directly funded by the state since its inception in FY14.
- The main finding from the data shown in Table 7 is that over the same FY11FY24 period during which state foundation formula funding for traditional districts was increasing by $2.29 billion (40.2%), state funding for community schools increased by $444 million (61.4%) and state funding for Ohio’s five voucher programs increased by an estimated $949 million (nearly 10.5 times its FY11 level).
Table 6: FY11-FY24 School District Formula Aid & Tangible Personal Property (TPP) Tax Replacement Payments ($ in Millions)
Sources: All funding data from ODE. Inflation rate data is based on the CPI-U and is computed on a fiscal year basis (July 1 – June 30). FY24 Inflation rate is through January 2024.
Table 7: FY11-FY24 School District, Community School & Voucher Funding ($ in Millions)