
I. FY24-25 School Funding Formula
Ohio’s current (FY22-23) school funding formula is based on the funding formula constructed by the Cupp-Patterson school finance workgroup of school superintendents and treasurers and is commonly referred to as the Fair School Funding Plan (FSFP). One of the most important features of the FSFP is its utilization of an inputs-based approach to determining adequacy resulting in a base per pupil amount which can vary across districts based on the number of students and their distribution across grade levels.
A second fundamentally important feature of the FSFP formula is its utilization of a state/local share mechanism reflecting each school district’s local capacity to raise revenue. The FSFP local capacity measure is based on both school district property valuation per pupil as well as on district total Federal Adjusted Gross Income per pupil and income per pupil based on each district’s median income multiplied by the number of tax returns and then divided by enrolled ADM. Each of these three per pupil wealth measures is combined into a single measure of local fiscal capacity with property valuation given a 60% weight and the two income measures each given 20% weight in the local capacity formula.
Fiscal years 2022 and 2023 represent years one and two of a planned six-year phase-in for the FSFP. In year one, funding for the components of the funding formula were at levels reflecting 16.67% of the increase to be achieved with full funding while in year two the phase-in percentage was increased to 33.33%.
However, the formula as enacted for FY22 and FY23 utilized salary data from FY18 rather than data from FY20 for FY22 and from FY21 for FY23 as would have been appropriate (the availability of salary data lags two years behind the current school year). The use of outdated data in the first two years significantly undermined the adequacy of the current formula.
Governor’s FY24-25 Budget Proposal
Governor DeWine’s FY24-25 budget proposal extended the phase-in of the school funding formula to years three and four. This would increase funding levels to 50% of the increase required for full funding in FY24 and to 66.67% of the increase required for full funding in FY25.
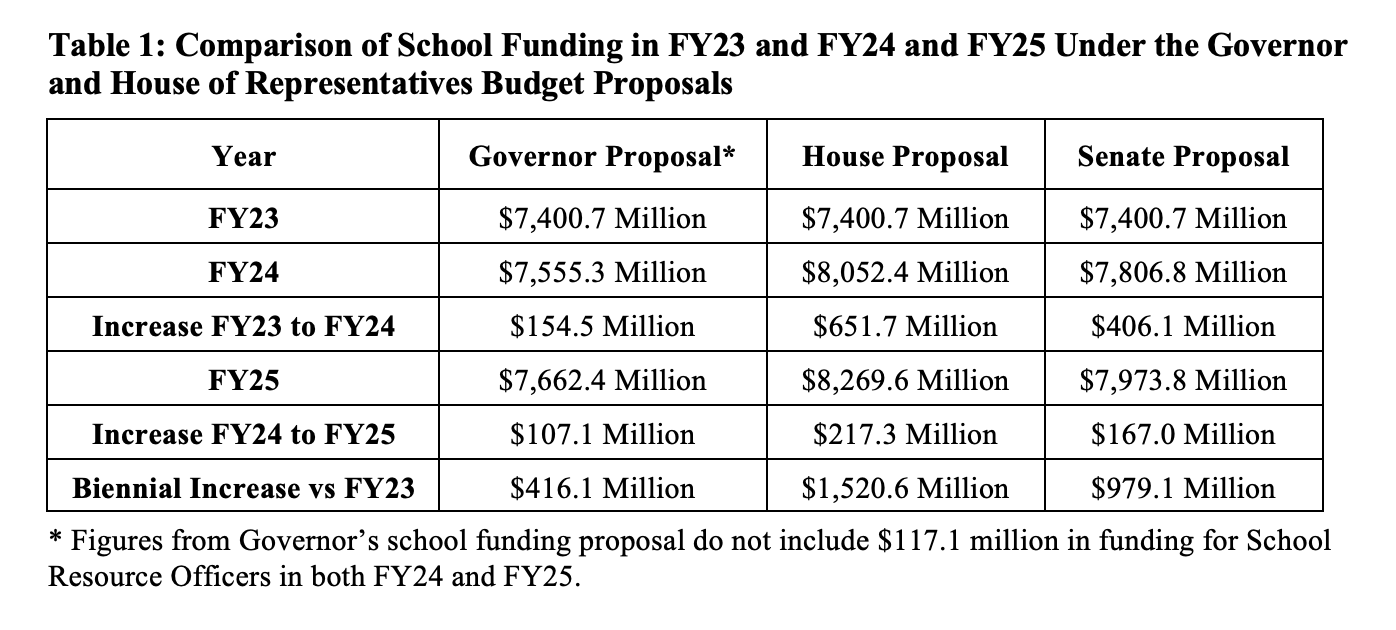
Most importantly, however, Governor DeWine’s FY24-25 budget continued the use of the FY22 statewide average base cost figure (based on FY18 salary data) in both FY24 and FY25. In order for funding to be considered adequate, the FY24 base cost should be using FY22 salary data and the FY25 base cost should be using FY23 data. As a result, the funding levels under the governor’s plan would have been based on salaries that were four years out of date in FY24 and five years out of date in FY25. Funding for the 609 traditional K-12 school districts in Ohio under the governor’s budget would have increased by $154.5 million (2.1%) from FY23 to FY24 and by an additional $107.1 million (1.4%) from FY24 to FY25. These modest increases in funding under the governor’s proposal were largely the result of the continued use of out-of-date data to determine the base cost.
House of Representatives FY24-25 Budget Proposal
The Ohio House of Representatives FY24-25 school funding formula differed from the governor’s by updating the salary data used in the base cost calculation from 2018 to 2022. This means that the most current data would be used in FY24. By updating the data used for the base cost calculation in FY24, the House school funding proposal addresses the most significant deficiency of Ohio’s funding formula as currently constructed. However, the base cost would not be updated with FY23 data in the FY25 school year under the House plan as would ideally be the case.
Under the House proposal, state funding for the 609 traditional K-12 school districts in Ohio would increase by $651.7 million (8.8%) from FY23 to FY24 and by an additional $217.3 million (2.7%) from FY24 to FY25. The House funding increase from FY23 to FY24 is much larger than the increase from FY24 to FY25 because the FY24 formula includes both the continued phase-in of the funding formula components from 33.3% to 50% as well as the updating of the input data whereas the funding increases in FY25 are only because of the extension of the phase-in to year four which increases the phase-in percentage to 66.67%.
Senate FY24-25 Budget Proposal
Like the governor and House budget proposals, the Ohio Senate’s budget continues the phase-in of the FSFP formula to years three and four and like the House plan, the Senate budget also utilizes FY22 inputs in both the FY24 and FY25 base cost calculation. However, the Senate budget does include three significant changes to the school funding formula for next biennium:
- Replace the current Temporary Transitional Aid (aka the “regular” guarantee which is based on FY20 funding levels), the Formula Transition Supplement (phase-in guarantee which is based on FY21 funding levels) and Supplemental Targeted Assistance with a new overall Transitional Aid Guarantee based on FY23 funding levels.
- Modify the state/local share calculation by removing the median income measure from the calculation of district wealth per pupil. Under the Senate plan, property wealth will continue to have 60% weight in the local capacity calculation, however, total Federal Adjusted Gross Income will now have 40% weight rather than 20% weight.
- Increase the minimum state aid percentage from 5% to 10%. This change will likely impact roughly 20 school districts.
The net impact of these changes is that formula funding for the 609 traditional K-12 school districts in Ohio increases by $406.1 million (5.5%) from FY23 to FY24 and by $167.0 million (2.1%) from FY24 to FY25. While these increases are larger than those proposed by Governor DeWine, the Senate budget results in a $245.6 million decrease in formula funding in FY24 as compared to the House budget and a $295.8 million decrease in formula funding vin FY25 as compared to the House budget.
Table 1 below provides a comparison of funding levels for traditional K-12 districts in FY24 and FY25 under the Governor, House and Senate budget proposals.
Analysis of Senate Funding Formula – Change to Local Capacity
The removal of the median income component of the local capacity calculation is by far the most significant change to the school funding formula made by the Senate. There are two reasons that the removal of median income should be considered to be a step backwards in the construction of an equitable, adequate and reliable school funding formula.
First, median income is a far more stable measure of school district income levels than is total Federal Adjusted Gross Income (FAGI). The reason for this is that total FAGI is subject to the influx or outflow of small numbers of high income taxpayers disproportionately impacting the total income in a district, such changes will have a much smaller impact on median income. For example, five high income taxpayers moving to a school district has the exact same impact on median income as does the move in of five taxpayers who are a relatively small amount above the current median income level, however it would increase total FAGI per pupil to a much larger degree. This makes median income a more stable measure of a district’s income over time than total FAGI.
Secondly, if the distribution of income is asymmetric (or “skewed” as statisticians say), then the median and the average will vary significantly from one another. In cases where a distribution of numbers is skewed towards the low end the median, it will be larger than the mean and in cases where the distribution is skewed towards the high end, the median will be less than the mean. Since income tends to be skewed on the high end (proportionally more high income persons than low income persons compared to the average income level) this means that median income will be lower than average FAGI per pupil in most school districts. Thus, the removal of the median income measure will make most school districts in Ohio appear wealthier than they are, unlike the current local capacity formula, resulting in a lower state share of aid.
The impact of the change made by the Senate to the state/local share calculation can be seen by the fact that only 63 of 609 (10.3%) of school districts receive more state aid under the Senate funding formula in FY24 than under the House formula, and only 67 of 609 districts (11.0%) receive more state aid in FY25 under the Senate formula than under the House formula.
Tables 2 and 3 below provide typology analysis comparing the House and Senate school funding formulas in FY24 and FY25. (Note that Tables 2 and 3 compare “Formula Aid” which includes the various components of the funding formula including transitional aid. It does not include funding for Preschool Special Education or Special Education Transportation.)
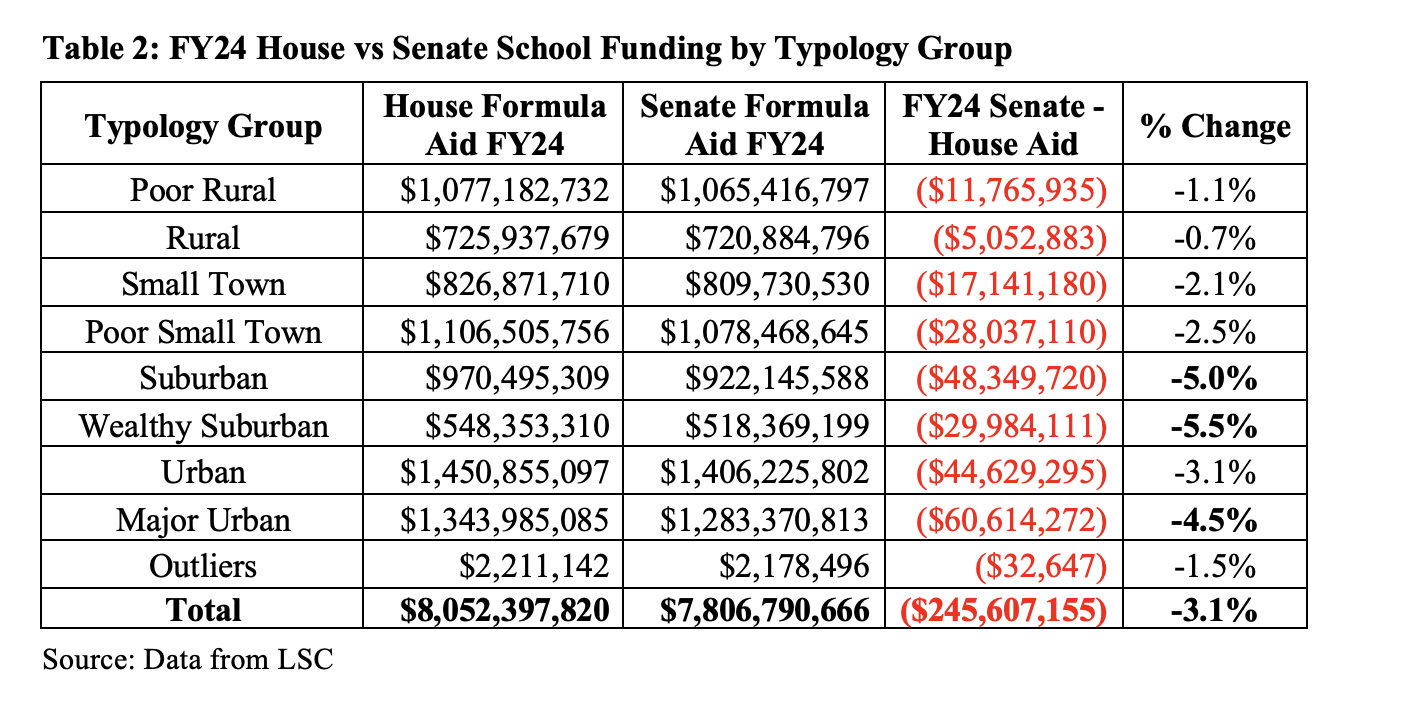
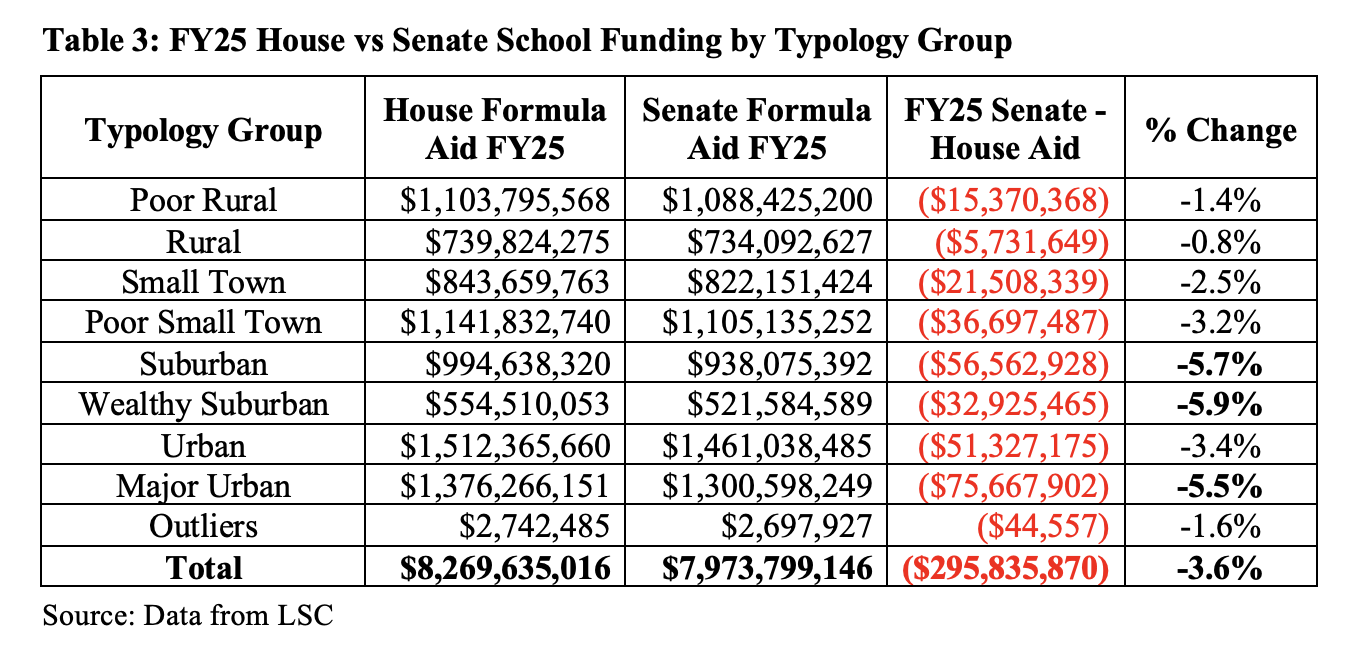
Tables 2 and 3 show that in both FY24 and FY25 all district typology groups receive less funding overall under the Senate funding formula as compared to the House, with the suburban and urban districts experiencing the largest percentage reductions.
Analysis of Senate Funding Formula – Change to the Guarantee
As mentioned above, the Senate budget for both FY24 and FY25 replaces the House’s multiple supplemental funding (i.e. “guarantee”) provisions with a single guarantee based on FY23 funding levels. Table 4 below provides a summary of the House and Senate guarantee provisions in both FY24 and FY25.
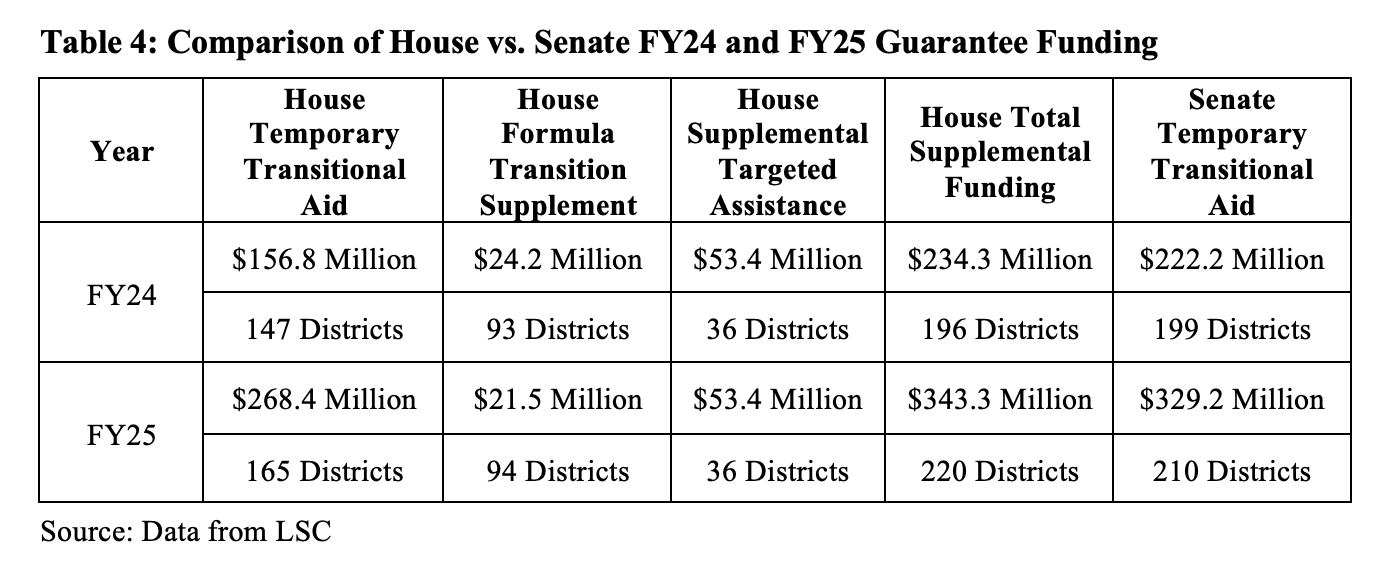
Table 4 shows that under the House school funding formula in FY24, 147 districts received a total of $156.8 million in temporary transitional aid, 93 districts received a total of $24.2 million in formula transition supplement aid, and 36 districts received a total of $53.4 million in supplemental targeted assistance. Altogether, 196 districts received a total of $234.3 million from one or more of these funding formula components in FY24 under the House plan. In comparison, under the Senate funding formula in FY24 199 districts received a total of $222.2 million under the unitary FY23-based transitional aid guarantee.
Table 4 also shows that in FY25 220 districts are estimated to receive a total of $343.3 million in funding formula or more of the three supplemental funding provisions under the House funding formula while 210 districts are estimated to receive $329.2 million in transitional guarantee funding under the Senate funding formula.
The figures in Table 4 indicate that under the Senate budget there is a net decrease in guarantee funding of $12.1 million in FY24 and $141 million in FY25 as compared to the House plan. Thus, based on the information currently available, the Senate guarantee results in a similar number of districts receiving a similar amount of supplemental funding as under the House proposal in both FY24 and FY25.
II. Changes to the EdChoice Voucher Program
There have been several proposals over the last three years to modify Ohio’s voucher programs. Governor DeWine’s FY24-25 budget proposed an increase in the eligibility level for the EdChoice Expansion voucher program from 250% of the Federal Poverty Level (FPL) to 400% of the FPL. (Note that eligibility for the EdChoice Expansion program is based on the household income of students, whereas eligibility for the EdChoice voucher program is based on the performance level of nearby public schools as measured by the school report card.) In 2023, the poverty level for a family of four is $30,000 which means that the governor’s proposal would increase the eligibility threshold from $75,000 to $120,000. Furthermore, 2021 census data indicate that roughly 46% of Ohio children aged 6-17 reside in households at or below 250% of the FPL while 69.0% of children are in households at or below 400% of the FPL.
The House proposal makes two changes relative to vouchers. First, the House proposal would further increase EdChoice Expansion eligibility to 450% of the Federal Poverty Level. This is an income level of $135,000 for a family of four. 2021 census data indicate that approximately 74% of Ohio children aged 6-17 are in households at or below 450% of the FPL.
Secondly, because the House funding increases the base cost in FY24 (due to the updating of the salary data as discussed above) the EdChoice and Cleveland voucher program voucher amounts will also increase. This is due to changes made in the FY22-23 state budget which tie the statewide average base cost in the funding formula to maximum voucher levels. The Legislative Service Commission estimates that the EdChoice voucher amount for K-8 students would increase from the current level of $5,500 per pupil to $6,165 per pupil while the voucher amount for EdChoice students in grade 9-12 would increase from the current level of $7,500 per pupil to $8,407 per pupil.
The Senate has further modified the EdChoice program to remove the income requirement for EdChoice Expansion entirely, although higher income students will be eligible for lesser voucher amounts. Table 5 shows the voucher amounts that students at various income levels would receive according to the Senate budget.
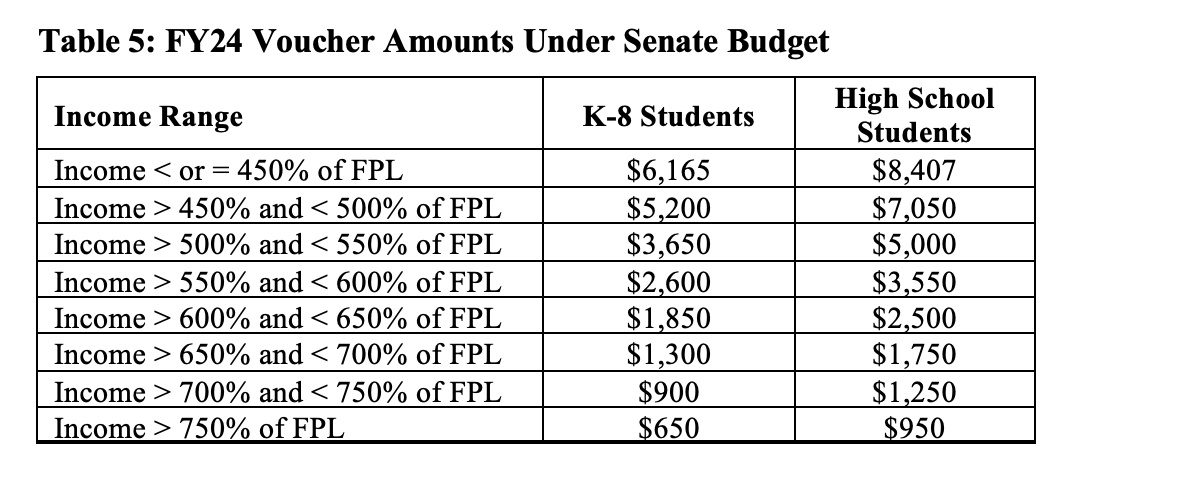
Table 6 below provides a summary of actual and estimated voucher payment amounts from FY22 to FY25.
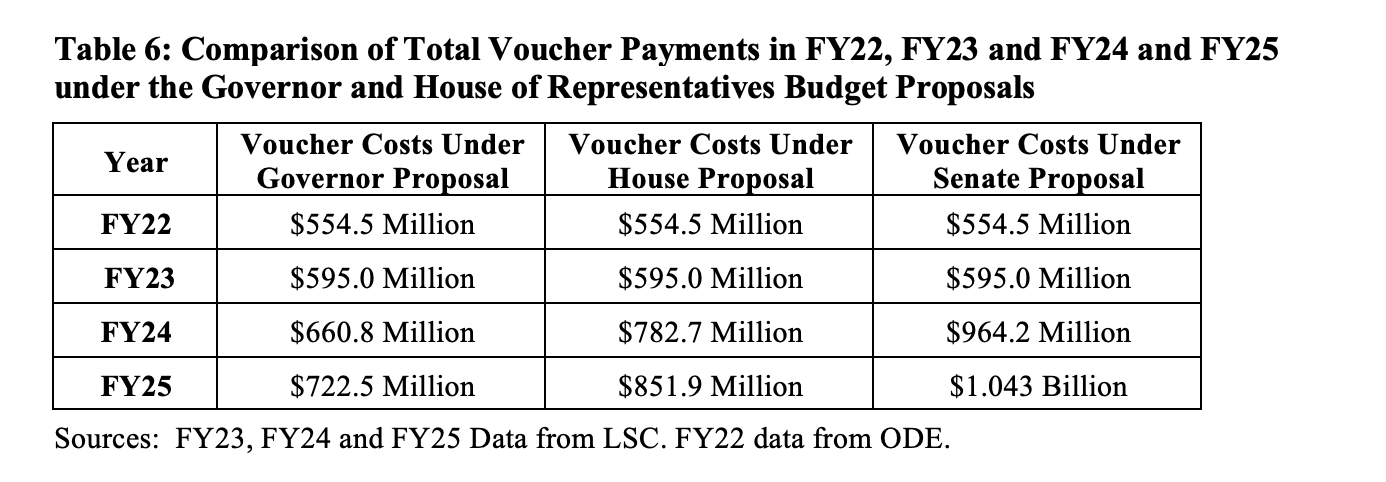
The data in Table 6 show that the Senate budget will increase the cost of Ohio’s voucher programs by $181.5 million in FY24 compared to the House and by $190.6 million in FY25 compared to the House. Table 6 also shows that Ohio’s expenditures on vouchers is slated to increase significantly under all three versions of the FY24-25 budget compared to current levels.
- The House budget will increase voucher funding by a total of $444.7 million over the FY24-25 biennium.
- Voucher funding in FY25 under the House plan is estimated by LSC to be $256.9 million (43.3%) higher than FY23 voucher spending ($595.0 million).
- The Senate budget will increase voucher funding by a total of $816.8 million over the FY24-25 biennium.
- Voucher funding in FY25 under the Senate plan is estimated by LSC to be $447.6 million (75.2% higher than FY23 voucher spending ($595.0 million).
Under the Senate budget proposal, data from Table 1 shows that funding for traditional K-12 districts is estimated by LSC to increase by $979.1 million over the FY24-25 biennium (compared to the FY23 funding level of $7.401 billion), while voucher funding is estimated to increase by $816.8 million over the FY24-25 biennium.
Under the House budget proposal, data from Table 1 shows that funding for traditional K-12 districts is estimated by LSC to increase by $1.521 billion over the FY24-25 biennium (compared to the FY23 funding level of $7.401 billion), while voucher funding is estimated to increase by $444.7 million over the FY24-25 biennium.